Trying to Create XmR Median R Charts in Excel?
QI Macros can create them for you!
Create an XmR Median R Chart using QI Macros
- Select your data.
- Click on QI Macros menu > Control Charts (SPC) > Special> XmR Median R.
- QI Macros will do the math and draw the graph for you.
Use an XmR Median R Chart to Evaluate Stability of Processes Using Variable Data
The XmR Median R Chart works just like the XmR Chart except that it uses the median range instead of the average as a measure of central tendency. Out of control ranges inflate the average, where the median does not.
Example of an XmR Median R Chart created using QI Macros
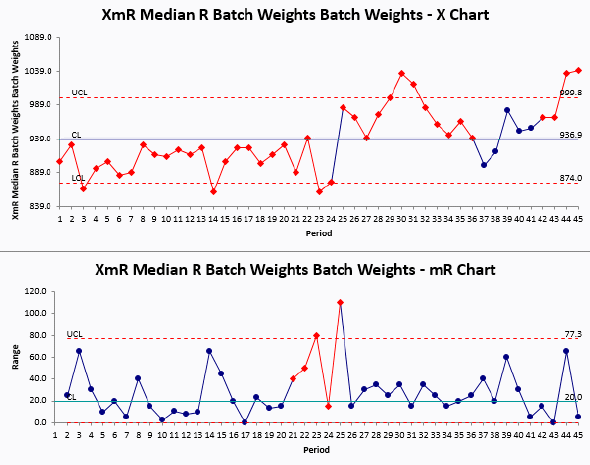
The XmR Median R chart can help you evaluate data when the range chart is out of control. It is not as good as the average when ranges are in control. Only use the median range when you think the average range is inflated.
Stop Struggling with XmR Median R Charts!
Start creating your XmR Median R Charts in just minutes.
Download a free 30-day trial. Get XmR Median R Charts now!
QI Macros Draws These Charts Too!
