What are the Nelson Rules for Control Charts?
QI Macros makes it easy to select and apply Nelson rules to control charts.
Draw control charts with QI Macros
- Select your data.
- Click on QI Macros menu > Control Charts (SPC) > XmR
- QI Macros will do the math and analyze the chart for you.
List of the eight Nelson Rules for interpreting control charts
Nelson Rules were developed in the 1950s and can be used with any control chart.
They include four Western Electric rules (1-4) plus four more (5-8).
- One point above UCL or below LCL
- Two points above/below 2 sigma
*Nelson Rules state that 2 out of 3 points above/below 2 sigma MUST be above OR below the centerline* - Four out of five points above/below 1 sigma
- Eight points in a row above/below the center line
- Six points in a row ascending or descending (trend)
- 15 points in a row "hugging" the center line (between -1 and +1 sigma)
- 14 points in a row alternating up and down
- Eight points in a row above 1 sigma or below -1 sigma
View examples of Western Electric rules 1-4
Examples of Nelson rules 5, 6, 7, and 8
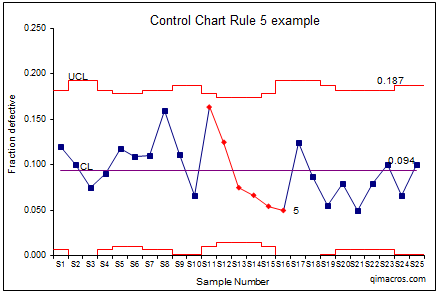
Nelson Rule 5
Six points in a row ascending or descending
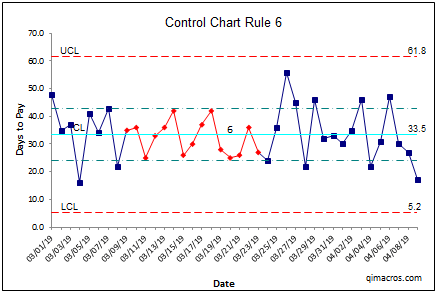
Nelson Rule 6
15 points in a row "hugging" the center line
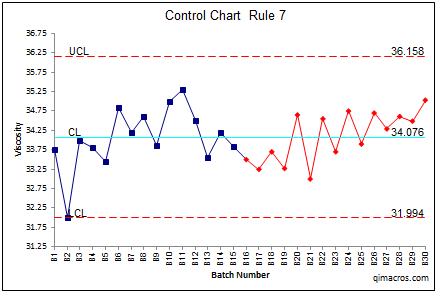
Nelson Rule 7
14 points in a row alternating up and down
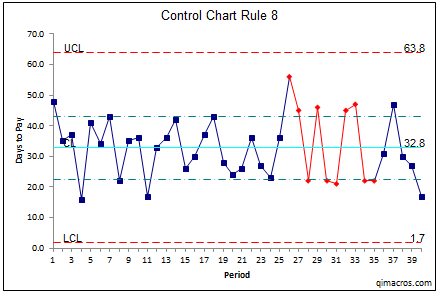
Nelson Rule 8
8 points in a row above 1 sigma or below -1 sigma
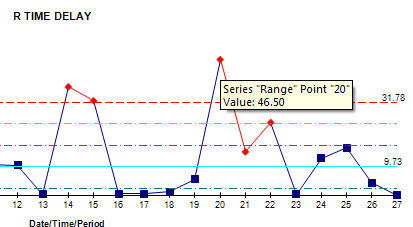
Special Case: XmR Charts use Nelson Rule for Moving Range
"Any moving range (Ri) greater than 3.5*Rbar should be removed from the average moving range calculation."
Source: Control Charts for Individual Measurements, Lloyd S. Nelson, Journal of Quality Technology, Vol. 14, No. 34, July 1982.
If you think about it, this makes sense. Any astronomical range value is most likely due to a special cause and/or process shift. Once determined to be a special cause, it can be removed from the calculation. This will tighten the limits and be more reflective of the process.
In example below, point 20 (46.50) is greater than 3.5*11.14 (original Rbar), so it will be removed from Rbar Calculation which changes Rbar to 9.73 and UCL/LCL for both the X and R charts.
Donald Wheeler, in Understanding Statistical Process Control 3rd (2010), disagrees with this rule and considers it invalid. In the Health Care Data Guide 2nd (2022), Lloyd Provost and Sandra Murray use this rule in an example on page 167. Who is correct? They all are depending on their point of view. I think Nelson's rule makes sense and saves time.
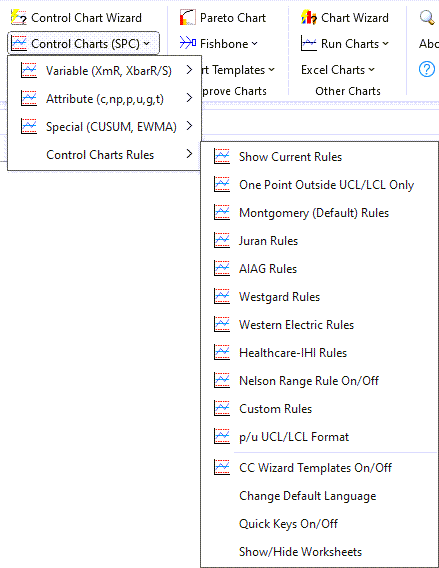
Turn Nelson's Special Case Rule for Moving Range On/Off
If you would prefer to disable Nelson's Special Case Rule for Moving Range, select Control Charts > Control Chart Rules > Nelson Range Rule On/Off:
NOTE: When Special Case is switched to "Off," if Healthcare/Montgomery/Nelson is selected as your current Control Chart Rules, Special Case does NOT automatically get switched to "On."
* Included in the April 2024 QI Macros release *
List of control chart rules available in QI Macros add-in for Excel.
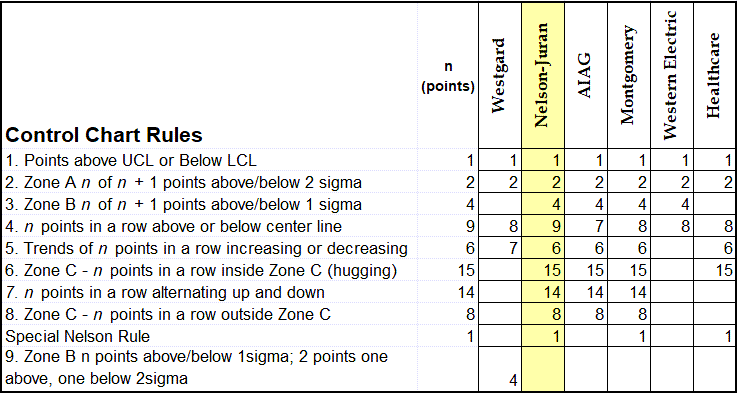
QI Macros use Montgomery's Rules as the default. However, you can easily switch to Nelson rules using the QI Macros menu.
Learn More...
- How to Change Control Chart Rules in QI Macros.
- Stability Analysis Using Control Chart Rules
- Westgard Rules
Stop Struggling with Control Charts!
Start creating your Control Charts in just minutes.
Download a free 30-day trial. Get Control Charts now!
QI Macros Draws These Charts Too!
