Not Sure Which Control Chart Rules are used in Healthcare?
QI Macros makes it easy to select and apply the right control chart rules.
Draw Control Charts using QI Macros
- Select your data.
- Click on QI Macros menu > Control Charts (SPC) > XmR
- QI Macros will do the math and analyze the chart for you.
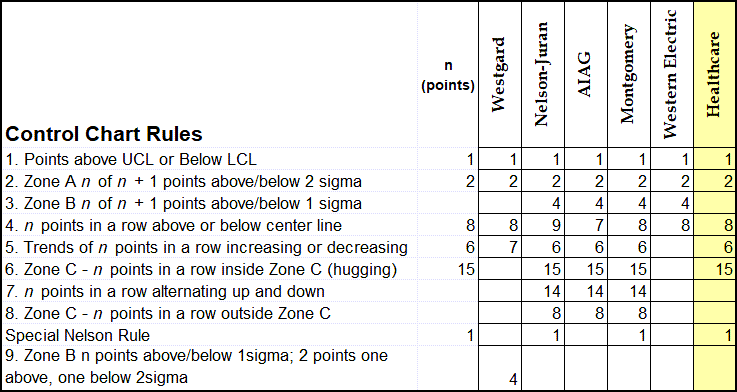
Why it Matters: Each industry uses slightly different rules to determine unstable points and trends on control charts. QI Macros enables you to choose the rules you want. Just make the selection once and those rules will be used on each chart moving forward.
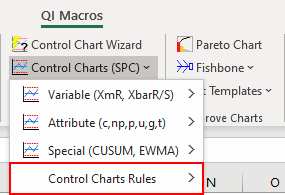
To make your selection, click on QI Macros menu > Control Charts SPC > Control Charts Rules > Healthcare IHI Rules.
What are the five healthcare control chart rules?
- One point above UCL or below LCL
- Two points above/below 2 sigma
*Healthcare Rules state that 2 out of 3 points above/below 2 sigma can span Above AND Below the centerline* - Eight points in a row above/below the center line
- Six points in a row ascending or descending
- 15 points in a row inside Zone C
Here are examples of each of the Healthcare Control Chart Rules
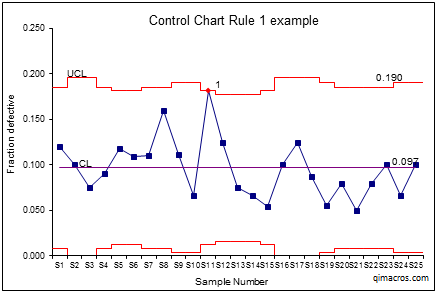
Healthcare Rule 1:
One point above UCL or below LCL
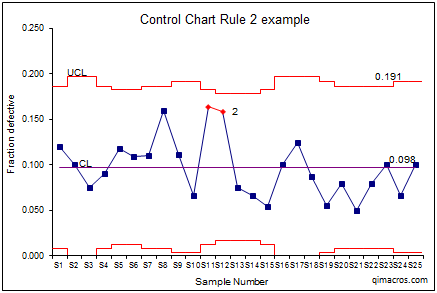
Healthcare Rule 2:
Two points above/below 2 sigma
Healthcare Rule 3
Eight points in a row above/below the center line
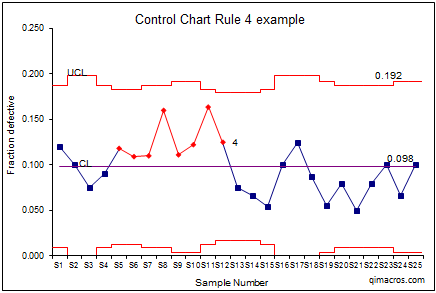
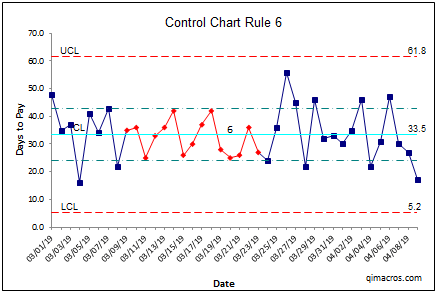
Healthcare Rule 4
Six points in a row ascending or descending
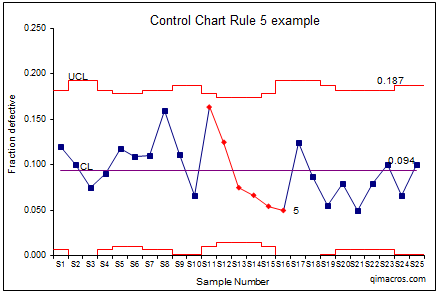
Healthcare Rule 5
15 points in a row "hugging" the center line
Healthcare rules and many other rule sets available in QI Macros add-in for Excel.
QI Macros use Montgomery's Rules as the default. However, you can easily switch to the Healthcare or other rules using the QI Macros menu. Learn more about customizing control chart rules used in QI Macros.
Learn More...
Stop Struggling with Control Charts!
Start creating your Control Charts in just minutes.
Download a free 30-day trial. Get Control Charts now!
QI Macros Draws These Charts Too!
