How do I Create Short Run Control Charts (DNOM) in Excel?
Traditional SPC uses 20 or more data points to develop a control chart. So what do you do if you only produce three of this widget, then four of another, and then six of something else? The answer: Short Run SPC.
In short run SPC, we're making a few parts of different sizes, so we can't really use the actual measurements. Instead of evaluating the variation of each measurement, we use the variation of parts from a target value. These are also known as Deviation from Nominal (DNOM) charts.
So, if the first group of parts has a target value of 74mm, we measure each part and determine the variation from the target. If the next group of parts has a target value of 60mm, we measure those and determine their variation. Ideally, the variation from the target value will remain stable even though the parts vary in size.
Short Run SPC Templates for Excel
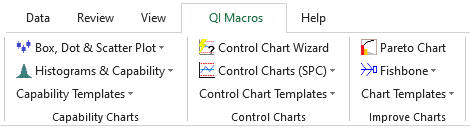
QI Macros provides templates for each type of short run chart. You can access these templates under the Control Chart Templates tab on the QI Macros menu.
1. Click on Control Chart Templates, then Special (Cusum, EWMA) then Short Run Charts.
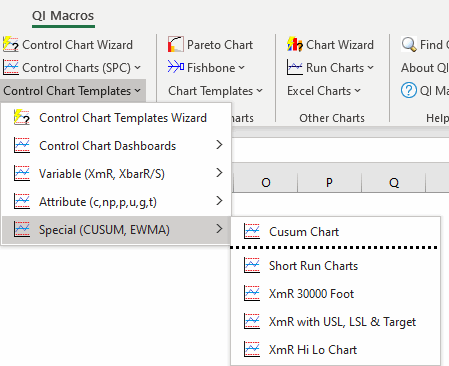
A template with several choices will open. Select the worksheet tab for the chart you want:

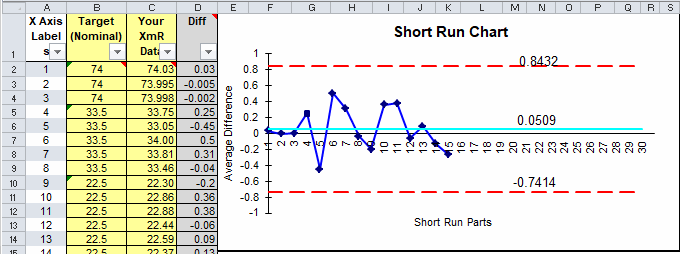
Input your target values and measurement values into the yellow cells. In the XmR example below, you'll notice there are three parts at 74mm, five at 33.5mm, and seven at 22.5mm. QI Macros will calculate the difference between the target and your data:
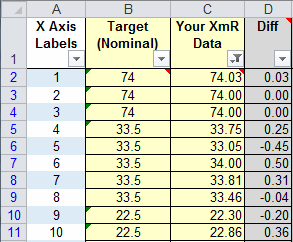
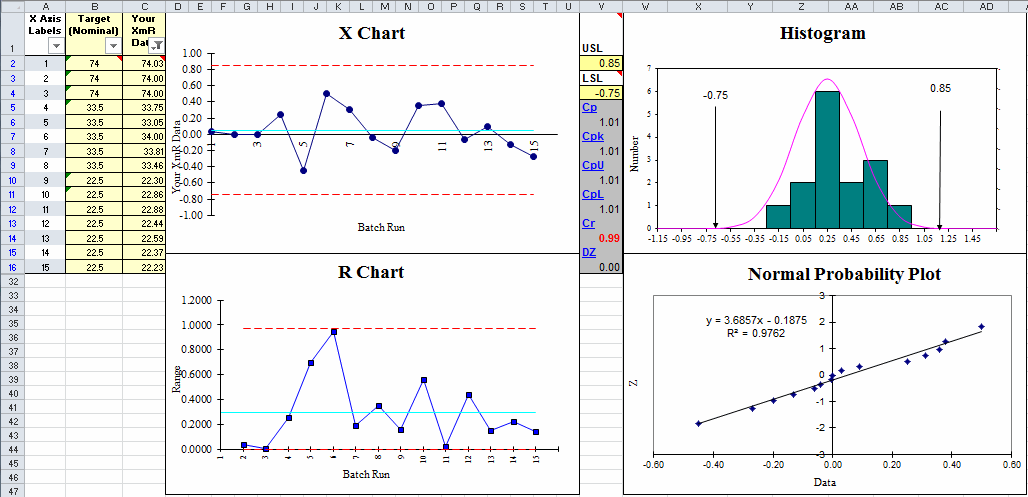
The "Difference" is used to create the short run chart. Even though the pieces vary in size, the variation from target is in control:
Short Run SPC isn't for everyone, but if your shop does a lot of small jobs, you might consider using short run charts to control the end product.
NOTE: As of the July 2018 release, QI Macros offers a ZmR Chart option.
Why Choose QI Macros Over Other Control Chart Software?
![]()
Fast and Easy to Use
- Works right in Excel
- Create charts in seconds
- Easy to customize & share charts
- Free Training Anytime
![]()
Proven and Trusted
- More than 100,000 users
- In More than 80 countries
- Five Star CNET Rating - Virus free
![]()
Affordable
- Only $369 USD
Quantity Discounts Available - No annual subscription fees
- Free technical support
