Trying to Create Bollinger Bands in Excel?
QI Macros can create Bollinger Bands for you!
Create a Bollinger Bands Chart using QI Macros:
- Select your data.
- Select Control Charts (SPC)> Special (CUSUM, EWMA)> Bollinger from the
QI Macros menu. - QI Macros will do the math and draw the chart for you!
Bollinger Charts Detect Potential Volatility in your Data Set
Bollinger Bands/Bollinger Charts input volatility bands above and below a Moving Average. The volatility is based on the Standard Devation that changes as volatility goes up and down. When volatility rises, the bands widen, while bands become smaller when volatility lowers.
NOTE: Bollinger only uses 2 Standard Devations, instead of 3 Standard Devations, when calculating the upper and lower limits.
Example of a Bollinger Chart Created by QI Macros Add-in for Excel
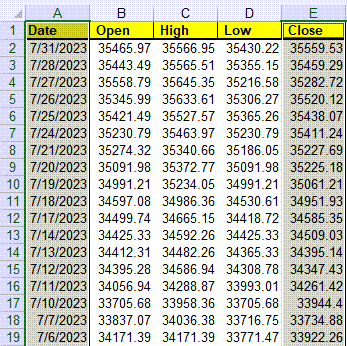
First, select your data (1 column of labels and 1 column of numerical data):
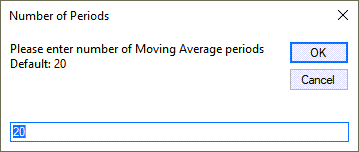
Then, you will be asked to input the number of Moving Average periods. The Default is 20:
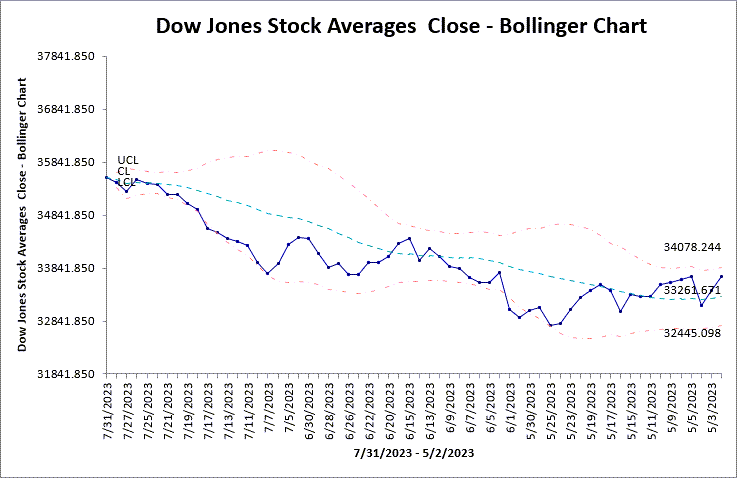
Bands will be automatically placed on your chart output, showing volatility levels within your data set:
Sample data used: "Down Jones Stock Averages" found in the "Moving Average.xlsx" sample data.
Stop Struggling with CUSUM Charts!
Start creating your CUSUM Charts in just minutes.
Download a free 30-day trial. Get CUSUM Charts now!
QI Macros Draws These Charts Too!
