Want to Do a One-Way MANOVA Test in Excel?
QI Macros can run a MANOVA test for you!
What is a MANOVA Test?
A Multivariate Analysis of Variance MANOVA test provides you with both regression analysis and analysis of variance and is used when there are two or more dependent variables. The general purpose is to determine whether multiple levels of independent variables on their own or in combination with one another have an effect on the dependent variables.
NOTE: When correlation is present between dependent variables, MANOVA can identify effects that are smaller than those that an ANOVA can find.
You Don't Have to be an Expert to Perform a One-Way MANOVA Test
- Does the thought of performing complicated statistical analysis intimidate you?
- Have you struggled with the awkward interface of Excel's Data Analysis Toolpak?
- Tried to learn another more complicated statistics program?
One-Way MANOVA Step-by-Step Example
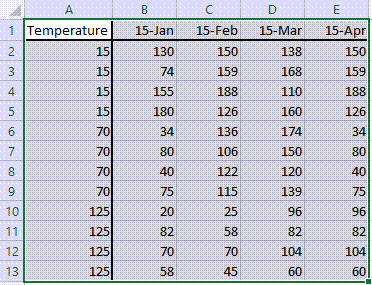
- Click and drag over your data to select it (MANOVA requires (2) or more columns of data):
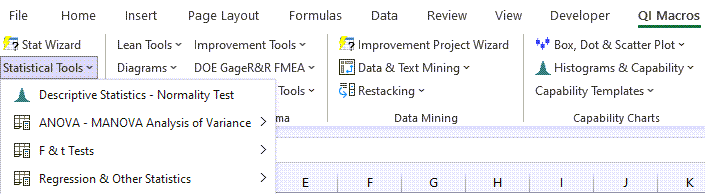
- Now, click on QI Macros menu > Statistical Tools > ANOVA - MANOVA Analysis of Variance, and select "MANOVA One-Way":
- If your first column of data is numerical, QI Macros will ask if the data represents "Labels" or "Values." For this example, we selected "Labels."
- The significance level will be automatically populated with the default of 0.05 (95% confident).
- QI Macros will perform the calculations for three type of tests: Wilks, Lawley-hotelling and Pillai.
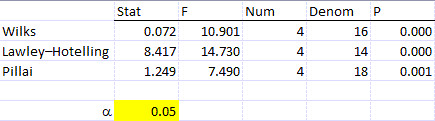
Unlike other QI Macros tools, changing the Alpha value does not update Wilks, Lawley-Hotelling, or Pillai outputs.
Note: MANOVA was added to the July 2023 version of QI Macros.
We will NOT be developing a Two-Way MANOVA in future QI Macros releases.
