Need to Transform Non-normal Data using LogNormal Transformation?
QI Macros can run a LogNormal Transformation on your data in seconds!
LogNormal Transformation uses a statistical calculation to transform non-normal data to a normal distribution so that additional analysis can be performed. LogNormal transformation requires data to be continuous (measured) and to only contain positive values.
LogNormal transformation shifts the data to a root of the data using lambda 1.
LogNormal Transformation Example Using QI Macros for Excel:
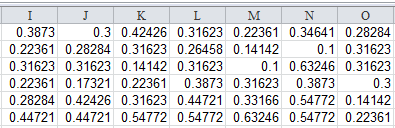
- Click and drag over your data to select it.
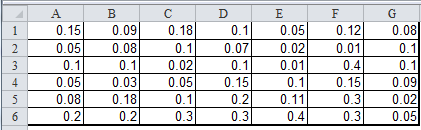
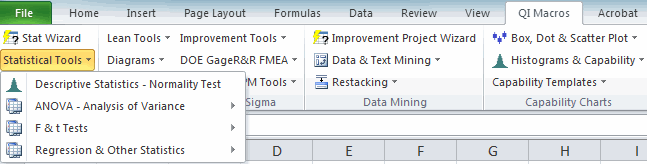
- Click on the QI Macros menu > Statistical Tools > Transformations > LogNormal:
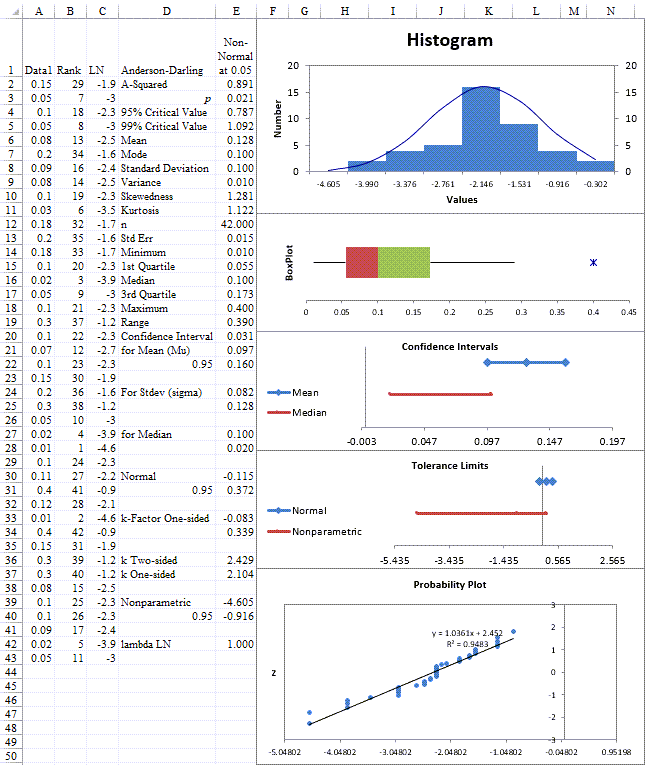
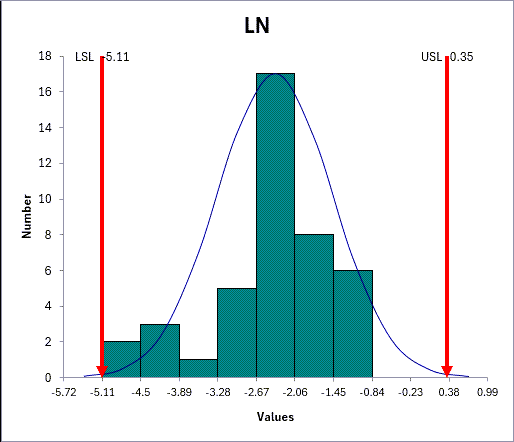
- QI Macros will automatically transform your data and provide you with a Histogram, BoxPlot, Confidence Intervals, and Tolerance Limits, as well as Probability Plot outputs:
If we ran a histogram on the before and after data sets we can compare the non-normal and normal distributions.
Non-normal Data
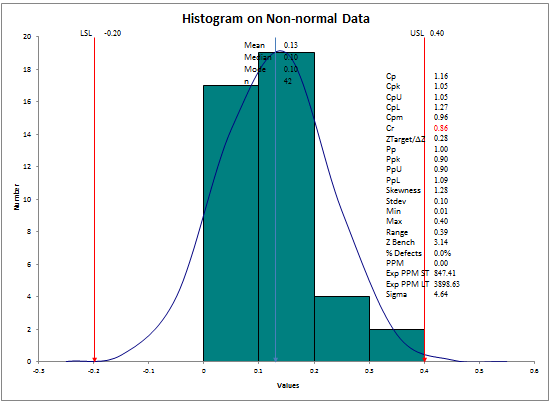
Normalized Data
*Included in the 07.2024 version of QI Macros*
Stop Struggling with LogNormal Transformation!
Start conducting LogNormal Transformation in just minutes.
Download a free 30-day trial. Run LogNormal Transformation now!
QI Macros can draw these charts too!
