PivotTable Exercise Dojo
Practice Using PivotTables to Develop Improvement Stories
Load QI Macros 30-day trial. Next click on QI Macros Help on the far right side of the menu to open the test data folder.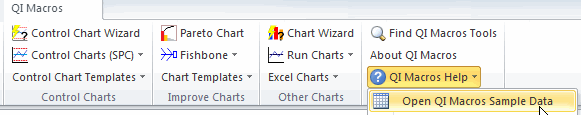
Open the pivottable.xlsx file and follow the Practice application to:
- Draw Control Charts to show defects or costs over time.
- Draw Pareto Charts to narrow the focus.
- When appropriate, in the PivotTable, double click on a Total for the "big" bar on the pareto to "drill down". Can you do another level of pareto?
- Insert an Ishikawa/Fishbone diagram into the PivotTable.
- Modify the problem statement to reflect one of the "big bars" on the pareto chart.
- Each of the three sheets should have a control chart, pareto chart and fishbone diagram when you're done.