Moving Average Chart
Watch this video to learn how to create a Moving Average Chart in Excel.
Learn More About Moving Average Charts
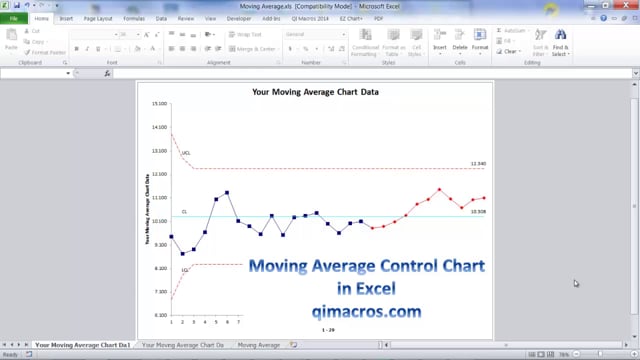
The Moving Average chart can help you evaluate a process when there is only one sample and you want to evaluate process shifts using a simple moving average (i.e., not the EWMA).
Why wait? Start creating these charts and diagrams in seconds using
QI Macros add-in for Excel.
« Back
Join 100,000+ Users
in 80 Countries
![]()
Why Choose QI Macros ?
Affordable - Just $
369 USD per license
- Less with Quantity Discounts
- No Recurring Annual Fees
- No Charge for Technical Support
Easy to Use
- Adds New Tab to Excel's Menu
- Creates a Chart in Seconds
- PC / Mac: Excel Excel 2013-2021, Office 365
Trusted /
Accurate
- 100,000 Users in 80 Countries
- Save Time vs Writing Formulas
- Our Formulas Are Tested

KnowWare International, Inc.
2696 S. Colorado Blvd., Ste. 555
Denver, CO 80222 USA
Toll-Free: 1-888-468-1537
Local: (303) 756-9144