Lean Six Sigma Demystified Webinar with Jay Arthur
Learn the Essential Tools of Lean and Six Sigma
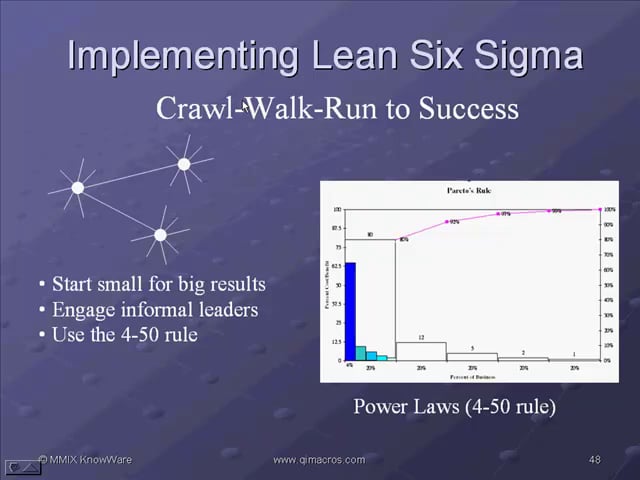
Every business process leaks money.
Find out how to use the tools of Lean Six Sigma to reduce the three types of leaks that are devouring your company's productivity and profit.
delays
defects
deviation
Watch the entire webinar or by topic below.

Watch the Entire Webinar
Reduce Delay Using Lean Simplified
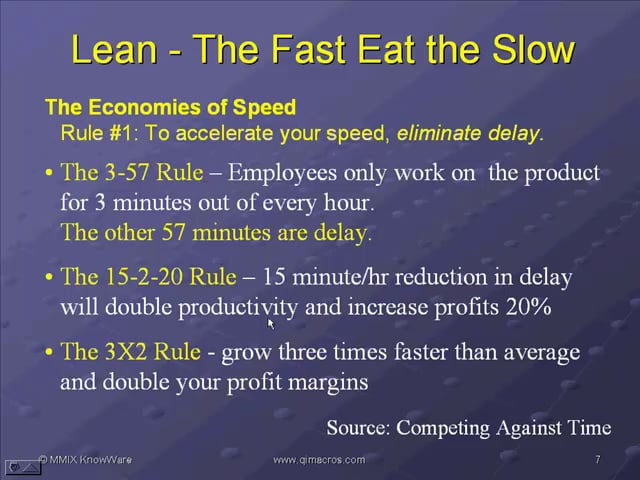
The Economies of Speed
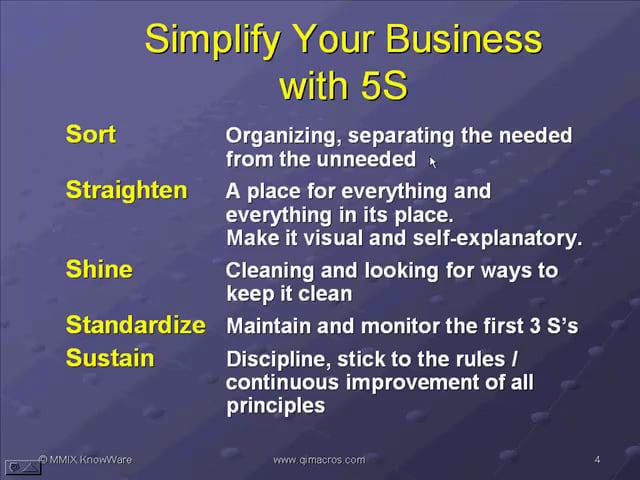
Simplify with 5S
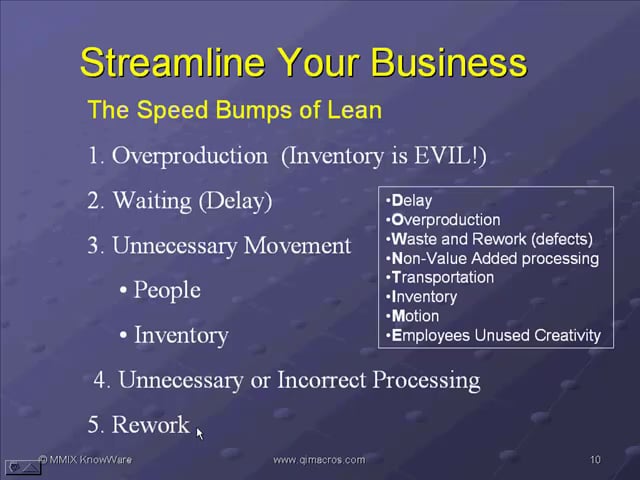
The 7 Speed Bumps of Lean
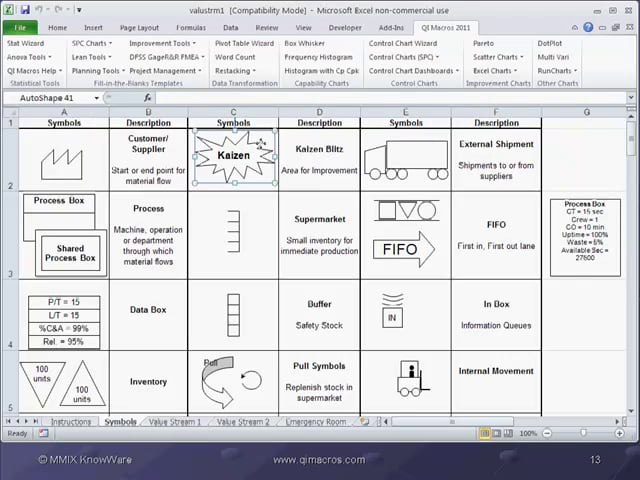
Value Stream Mapping
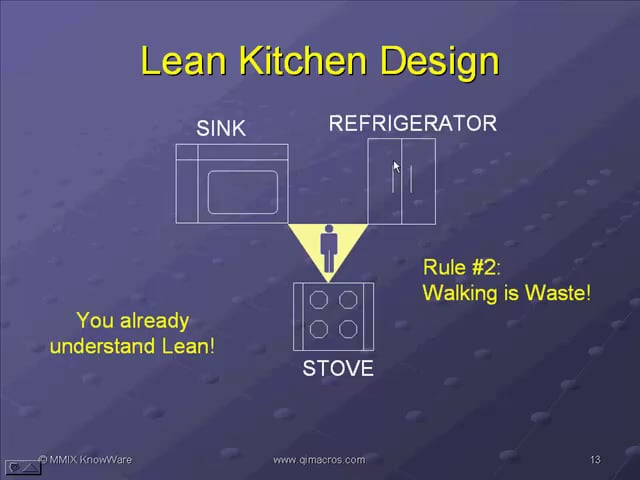
Spaghetti Diagramming
Reduce Defects and Deviation Using Six Sigma Simplified
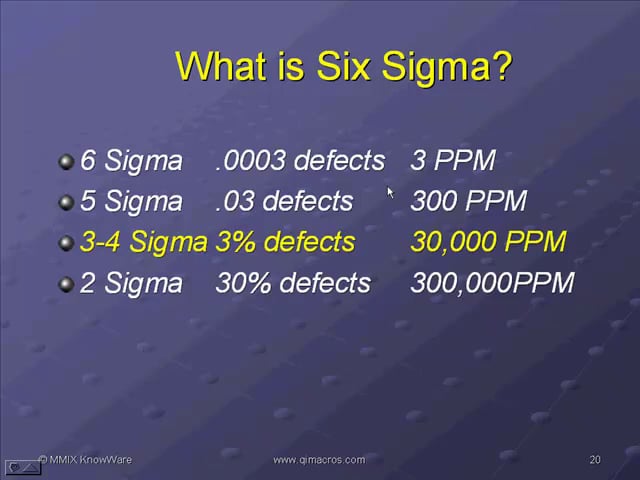
What is Six Sigma ?
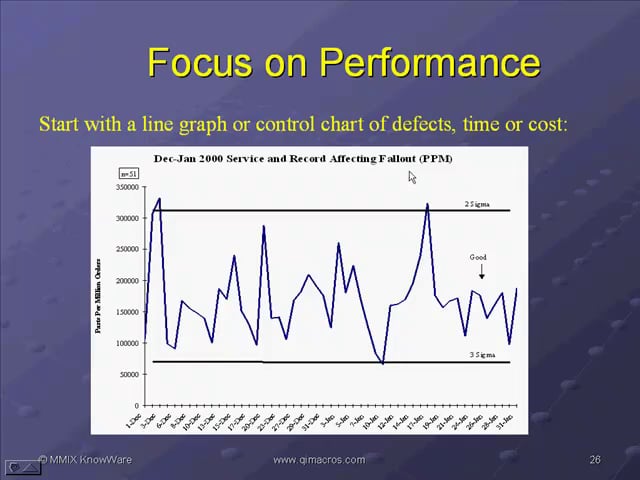
Reducing Defects - Example
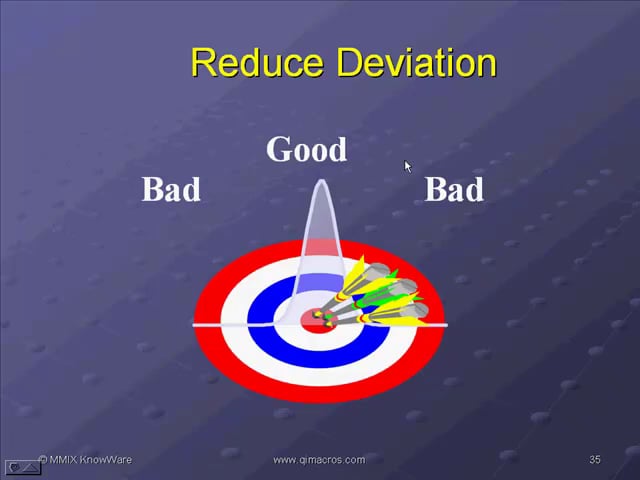
Reducing Deviation - Example
Implementing Six Sigma
Stop using old technology!
Upgrade Your Excel and Data Analysis Skills to Smart Charts Using QI Macros.
Track Data Over Time
Primitive Chart

Line Graph
Line Graph
Smart Chart
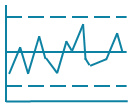
Control Chart
Control Chart
Compare Categories
Primitive Chart
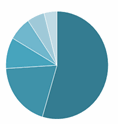
Pie Chart
Pie Chart
Smart Chart

Pareto Chart
Pareto Chart
Analyze Variation
Primitive Chart
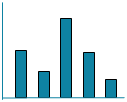
Bar or Column Chart
Bar or Column Chart
Smart Chart
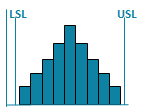
Histogram
Histogram
QI Macros add-in for Excel makes creating smart charts a snap.
Join 100,000+ Users
in 80 Countries
![]()

KnowWare International, Inc.
2696 S. Colorado Blvd., Ste. 555
Denver, CO 80222 USA
Toll-Free: 1-888-468-1537
Local: (303) 756-9144
©
1997 - 2024 KnowWare International Inc. All Rights Reserved. Legal Info | Terms of Use