Home »
Blog » QI Macros » Page 41
Improvement Insights Blog
Posts tagged "QI Macros"
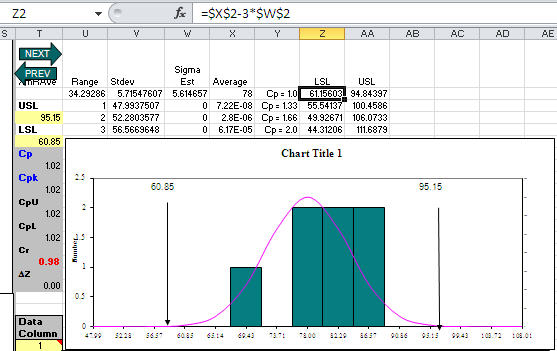
Customer asked me what seemed like a strange question: What specification limits do I need to get a Cp greater than one? Usually her customer should set specification limits, but her boss wanted to know what they could deliver. Hmmmm!
Then I realized that since QI Macros templates (e.g., XmR chart) calculate the average and sigma estimator, the LSL/USL for Cp = 1.0 would be:
LSL = Average – 3*SigEst USL = Average+ 3*SigEst
For Cp = 1.33, just change the 3 to a 4; Cp = 1.66, change the 3 to a 5. Here’s an XmR chart template with some sample data and calculations to reverse engineer spec limits:
Continue Reading "What USL/LSL Do I Need for Cp>1?"
Posted by Jay Arthur in QI Macros, Six Sigma, Statistics.
Early in the movie, the McDonald’s brothers describe how they came up with the concept for speedy service. It’s Lean.
They had too many menu items, so they decide to simplify down to burgers, fries and soft drinks. (Think Lean inventory.)
They go to a tennis court and use chalk to lay out a possible floor plan to deliver service fast. One brother stands on a ladder watching while the employees pantomime cooking burgers, fries and soft drinks.
They go through several iterations to converge on their final design. (Think value stream mapping and spaghetti diagramming.)
I think they might have done it faster with cardboard boxes, but I wasn’t there.
Continue Reading "Lean Insights from “The Founder” Movie"
Posted by Jay Arthur in Healthcare, Lean, Manufacturing, Service.
Many people avoid Six Sigma because they think it involves a lot of math and statistics. You know, formulas. I don’t think you need any formulas. You don’t need to be a statistician. You just need software that went to college and knows the formulas.
In The Math Gene, Author Keith Devlin explores “why so many people find mathematics impossibly hard.” He says: mathematics is the science of patterns. Isn’t that what we’re trying to do in Six Sigma, separate the wheat from the chaff, separate the signal from the noise and detect the underlying patterns of performance?
Continue Reading "Is Fear of Math Holding You Back?"
Posted by Jay Arthur in QI Macros, Six Sigma.
Nobody wants to read your spreadsheet! No matter how hard you try to make it pretty, create great labels or whatever, the only person who can read your spreadsheet is a CFO or Excel spreadsheet geek. And the Excel geek is going to tell you 10 ways to make it prettier.
The purpose of data is to provide insights for action, not just report past performance.
How Do I Know That Most Excel Users Try to Make Their Spreadsheets Readable By People?
According to Renu Davi, Sr. Program Manager for Excel, Microsoft tracks how people use Excel. The vast majority of the 650 million users use it for lists and reports.
Continue Reading "Nobody Wants to Read Your Spreadsheet!"
Posted by Jay Arthur in Data Mining, QI Macros, Six Sigma.
I got a call from a QI Macros customer who works at a luxury car dealership. Customers were upset because their cars were spending too long in the shop. The dealership tracked the length of stay of every car, the symptoms and barriers to getting the car done when expected.
I was struck by the similarities between what he was describing and a hospital. Patients come in, get diagnosed, treated, admitted and eventually discharged. This is the same problem as the maintenance shop.
I asked if the maintenance department had information about the type of problem, missing parts, age of the car and so on.
Continue Reading "How is a Hospital Like a Car Dealership?"
Posted by Jay Arthur in Healthcare, Lean, QI Macros, Service, Six Sigma.
Creating homemade Cp and Cpk templates often results in incorrect values. There are many, many mistakes you might make without realizing. Here are a few examples.
A customer sent me their home grown template for calculating Cp and Cpk and wondered why the QI Macros got such radically different values. It was easy to see from their data that they were using standard deviation, not Sigma estimator (Rbar/d2) to calculate Cp and Cpk. Use Stdev to calculate Pp and Ppk, not Cp and Cpk:

They had run the QI Macros histogram on two columns of data, one measured at 0 degrees and one measured at 90 degrees.
Continue Reading "Cp Cpk Formulas and the Mistakes in Homemade Templates"
Posted by Jay Arthur in Manufacturing, QI Macros, Six Sigma, Statistics.
Charles Duhigg, in his book Smarter, Faster, Better, describes a condition he calls “information blindness.” When faced with too much information, people shut down because they don’t know what to do with it.
I find this is true in most companies. They collect tons of data, but can’t “winnow” the data down into the vital few bits of information that would transform their business. What I invariably do is use PivotTables, control charts and Pareto charts to find the “vital few” bits that tell us exactly where to find and fix the problems that cause over half of the waste, rework and lost profits.
Continue Reading "Information Blindness"
Posted by Jay Arthur in Six Sigma.
At the ASQ Lean Six Sigma Conference, the QI Macros booth was right next to my biggest competitor–the big dog in the market (you know who they are). A guy comes up to me and says: “We bought 150 copies of their product (pointing to the booth next to me) and it was really expensive. I asked our Green Belts if they were using it and they said No, it’s too hard to use. What are they using; they said Excel.” He went on to say: “I’m thinking about getting the QI Macros because everyone is comfortable with Excel.”
And he wasn’t the only attendee who complained about the same issues: costs too much and too hard to use.
Continue Reading "Complex Statistical Software–a Barrier to Six Sigma"
Posted by Jay Arthur in QI Macros, Six Sigma.
Downloaded and installed Excel for the iPad. It’s provides basic Excel functionality. As expected, it will handle QI Macros charting templates, but won’t run macros. https://www.qimacros.com/store/?cat=14
To get the full functionality of the QI Macros or to run any Visual Basic addins, you’ll need a Windows 8 tablet running Excel 2010 or Excel 2013.
I tried several Win 8 tablets.
The Surface Pro is fast, but heavy and runs warm because of the I5 processor. I didn’t love the keyboard.
I tried the Samsung, but it had an idiot light that blinked when closed that ate 5% of the battery every day.
Continue Reading "Excel App for the iPad and QI Macros"
Posted by Jay Arthur in QI Macros.
A QI Macros customer recently asked: ” What is a reasonable and productive ratio of Lean or Six Sigma expert (LSSBB, for example) to staff for a healthcare organization that is starting the journey?”
The general consensus I can find online about Six Sigma belts/employees is:
1 BB/100 employees
3 GB/100 employees
I think these numbers are designed to keep Six Sigma training companies in business.
Depending on the size of a Medical center, you could use one BB and some GBs to get started. You can’t fix everything all at once, so one BB ramrodding a handful of GBs to solve key problems would be a good start.
Continue Reading "How Many Green and Black Belts Do You Need?"
Posted by Jay Arthur in Lean, Service, Six Sigma.

