Home »
Blog » Page 33
Improvement Insights Blog
Latest Posts
If COVID-19 has taught us anything, it’s that we can’t keep doing things the same old way. The status quo isn’t working for us anymore. We have to stop projecting the past (the way we’ve always done it) into the future. The future doesn’t have to be an endless rerun of the past.
“Hi, I’m Jay Arthur, author of “Agile Process Innovation” and QI Macros [software]. Here’s my Improvement Insight for this week: Stop projecting your past into your future.
“Way too many people do this, right? We start thinking, “Well, we’ve always done it that way so we have to always do it that way.”
Continue Reading "Stop Projecting the Past Into the Future"
Posted by Jay Arthur in Improvement Insights.

Like a lot of you, I’ve gotten really good at some things I wasn’t very good at a couple of months ago. From a personal perspective, my cooking has gotten much better (thanks to online cooks I found such as Chef John). From a business standpoint, I’ve gone from meeting clients face-to-face to becoming good at conducting most of my business via online video meetings with clients. The online video meeting has its ups and downs, but it sure is nice to be able to meet with someone on the other side of the country without having to spend time traveling.
Continue Reading "The lines on the road…"
Posted by Jay Arthur in QI Macros Monthly Newsletters.
The busiest day of the year for long distance calling is Mother’s Day. The recent COVID-19 pandemic revealed the inability of our systems to handle the load. Is your business ready for Mother’s Day?
“Hi, I’m Jay Arthur, author of “Lean Six Sigma Demystified” and the QI Macros [software].
“When I worked in the phone company they were very proud of the fact that they had engineered the entire switching system to handle one day out of the year. That one day out of the year was Mother’s Day, because everybody called their mother on Mother’s Day. If we didn’t have ways of switching and routing things and [finding] an empty trunk line… If I was going to call my mom in Tucson from Denver, guess what?
Continue Reading "Are Your Systems Ready for Mother’s Day?"
Posted by Jay Arthur in Improvement Insights.
Control charts offer a promising way to analyze COVID-19 Data. Learn where to get the data, how to mine it and how to chart it in this video.
Continue Reading "Create a COVID-19 Control Chart Using QI Macros"
Posted by Jay Arthur in Ask Jay, Data Mining, QI Macros, Six Sigma.
People over age 55 account for 92% of COVID-19 Deaths (data from CDC). Sweden is using similar data to leave the country open for most citizens while asking seniors to stay at home. How do we reopen the economy? Self-quarantine seniors; let everyone else get back to work.
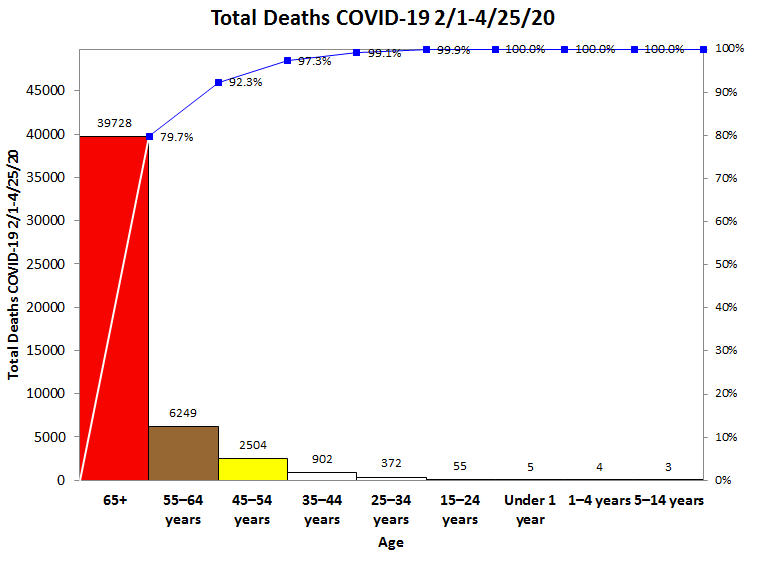
Here’s the 2019-2020 Influenza (i.e., Flu) deaths. Again, seniors are 83.5% of deaths. The flu death rate is about 1 per 1,000. COVID-19 death rate is 1-2 per 100, perhaps lower in people under the age of 55 and higher for those over age 55.
Countermeasure: Self-quarantining seniors will help flatten the curve and prevent overwhelming healthcare.
Continue Reading "U.S. Deaths by Age Group as of 4/24/2020"
Posted by Jay Arthur in Healthcare, Jay Arthur Blog, QI Macros.
We know that Lean can collapse cycle time by 75% or more. Here’s what that means for COVID-19:
“Hi, I’m Jay Arthur, author of “Lean Six Sigma for Hospitals” and QI Macros [software].
“If you’ve ever done any Lean projects, you know pretty much if the process is this long {gestures}, with Value Stream Mapping and Spaghetti Diagramming, you can collapse that by maybe 75%, 80%, 90%. You can actually reduce the cycle time for almost anything and do it easily.
“One of the things that is creating optimism for me is that a few years ago I worked with an aerospace manufacturing company, and typically to get a Request For Proposal through, it was 1.9 years for any new part.
Continue Reading "Lean Response to COVID-19"
Posted by Jay Arthur in Healthcare, Improvement Insights, Lean.
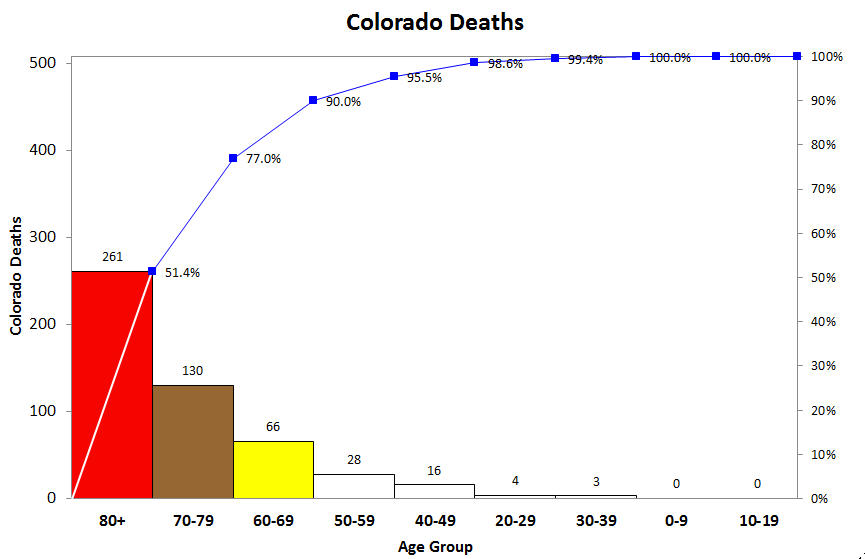
Since 90% of deaths are among those over 60, perhaps the best countermeasure is to require those of us over 60 (me for example) to stay home. Most of us are retired anyway. Let others go back to work.
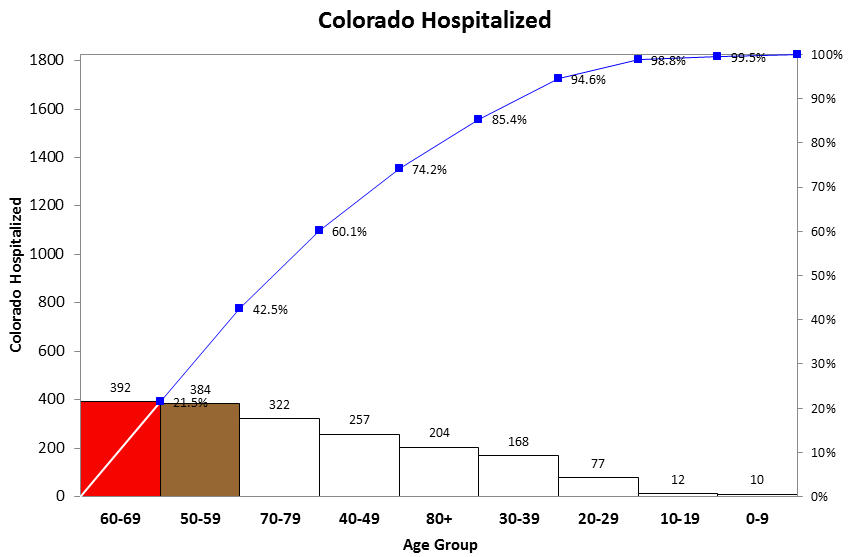
Approximately 51% of Colorado hospitalizations involve people 60-80+, 75% of people over 50. Another reason to ask seniors like myself to stay at home even as the economy reopens. This will help reduce the load on hospitals.
Continue Reading "Colorado Deaths by Age Group"
Posted by Jay Arthur in QI Macros, Six Sigma.
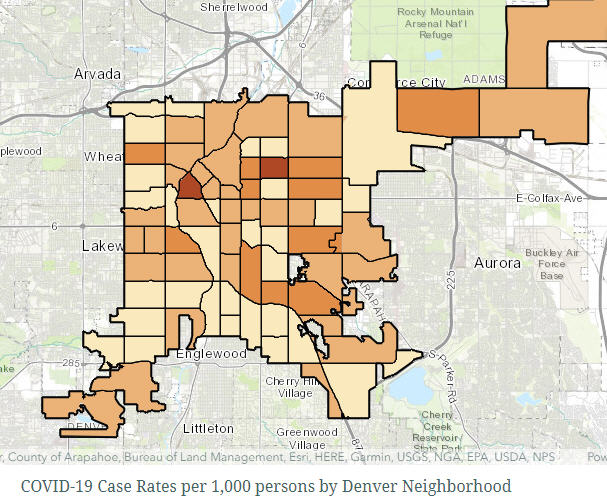
There are COVID-19 hot spots and cold spots. How do we keep the cold spots open and detect and quarantine warming spots? Maybe statistical process control can help.
“Hi, I’m Jay Arthur, author of “Lean Six Sigma for Hospitals” and QI Macros [software].
“Back in the mid 1800s there was a cholera outbreak in London, and John Snow (not of Game of Thrones, but Dr. John Snow) said, “I think there’s a pattern here.” He went out and figured out that everybody who had cholera was getting water from the Broad Street pump. Back then, there was no indoor running water so you had to take your pail, go out to the pump and get your water for your home or your business or your restaurant.
Continue Reading "Cholera and COVID-19 Hot Spot Detection and Quarantine"
Posted by Jay Arthur in Improvement Insights, Six Sigma.
Should a project take 4-16 months or 4-16 hours? Should you measure projects with a calendar or a stopwatch? I think the answer is obvious, but here’s my take on it.
“Hi, I’m Jay Arthur. Every year, we exhibit at lots of conferences with QI Macros so I get to go to presentations by all kinds of folks. Now, last year I saw a presentation by some consultants who said they’d done some research into how long Six Sigma projects take. They found Six Sigma projects take anywhere from four months to 16 months.
“I [thought], “What? How’s that possible?” That makes no sense to me, because I’ve done multimillion-dollar projects in between 4 and 16 hours.
Continue Reading "How Long Should Lean Six Sigma Projects Take?"
Posted by Jay Arthur in Agile Lean Six Sigma, Data Mining, Improvement Insights, QI Macros.
I started wondering, what would the COVID-19 pandemic look like as an improvement story. We have charts about cases and deaths. What might be the root causes and potential countermeasures? Here’s my draft Ishikawa-fishbone root cause analysis diagram and countermeasures. Root causes circled in red.
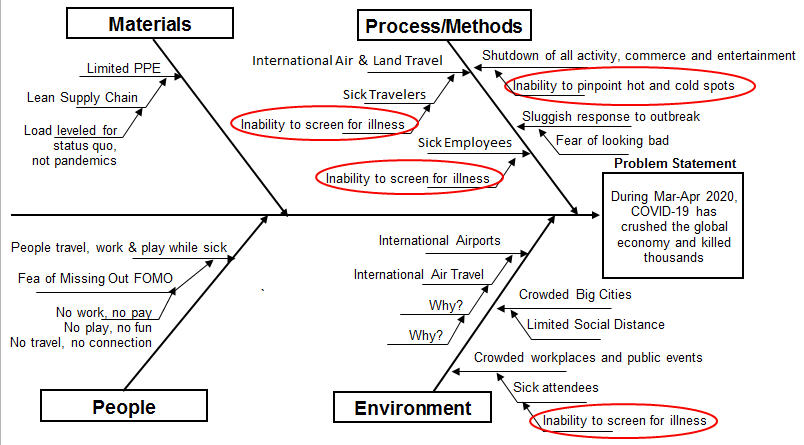
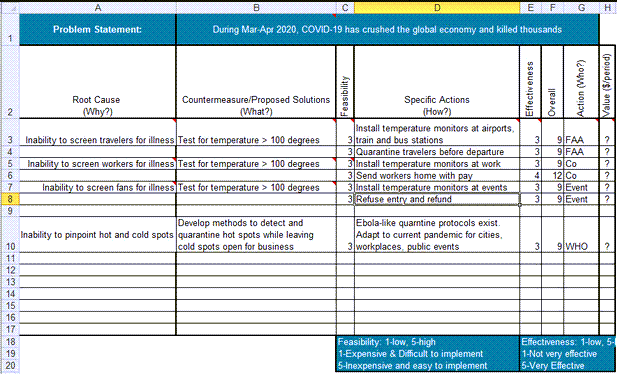
We screen for guns in luggage and knives on passengers, why not temperatures?
As of 4/12/20, NYC accounted for over a third of U.S. COVID-19 cases and almost 50% of deaths. It’s a hot zone. According to one employee, Denver General Hospital has not had a single COVID-19 patient. It’s a cold zone. What are the boundaries of the cold zone?
Continue Reading "COVID-19 Root Cause Analysis and Countermeasures"
Posted by Jay Arthur in Agile Lean Six Sigma, QI Macros, Six Sigma.