Improvement Insights Blog
Data Visualization and Exploration In Excel
You can use Excel’s data formatting, commenting and filtering tools to help visualize and clarify your data.
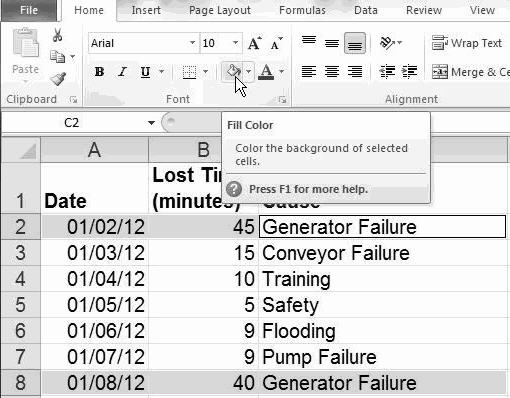
Highlighting: Select cells and click on Home-Fill Color to highlight cells:
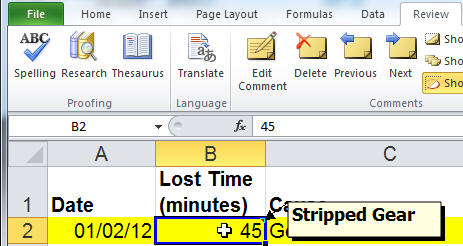
Commenting: To add comments to any cell, click on Data-Insert Comment:
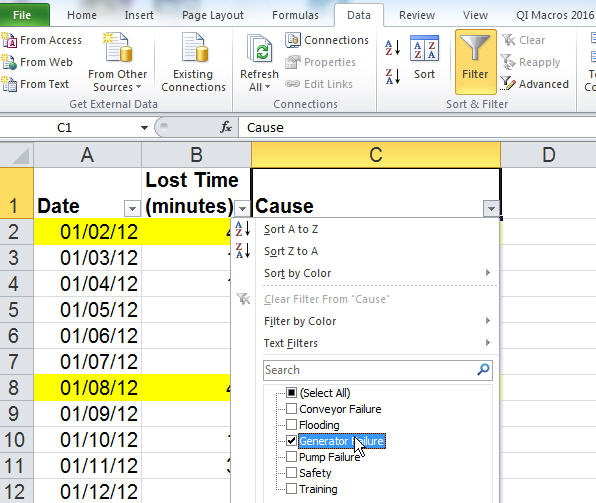
Subset: To select a subset of your data, click on Data-Filter and select the desired content:
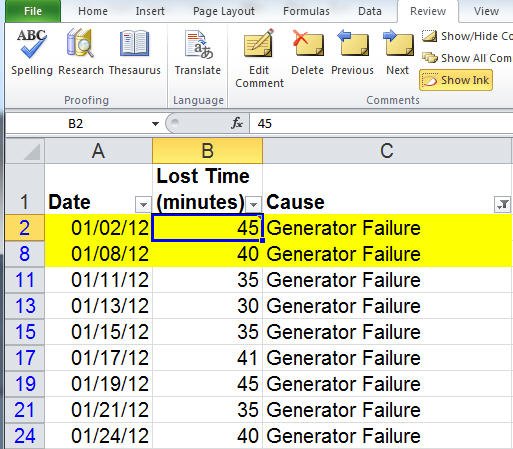
Excel will simplify and streamline your data for ease of analysis:
Excel has many powerful data exploration and visualization tools. Play with them!

