Finally — SPC Software That Works Inside Excel
QI Macros Automates Selection and Creation of Control Charts,
Even If You Don't Know ANYTHING about Control Charts!
The control chart and histogram macros in QI Macros alone have saved me hours of work and allowed me to present data to management in a format that is meaningful.
– Kyle Dopp, First Choice Solutions
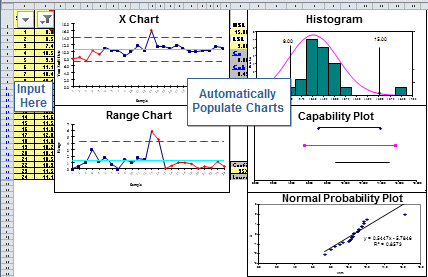
From Raw Data to Control Chart in Under 30 Seconds
Spend more time analyzing performance and less time struggling with choosing charts and formulas.
Unique Features that Make QI Macros Your Best Choice
Control Chart Wizard Automates Selection
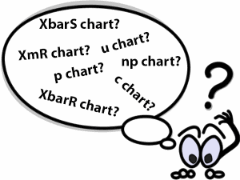
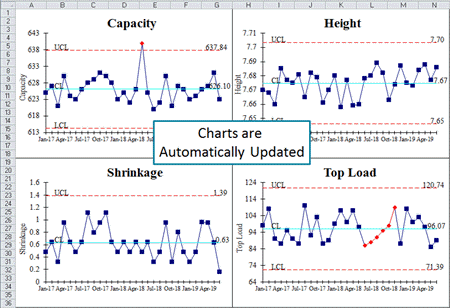
Chart Menu Automates Process Changes
Once you create a control chart, its easy to update or customize it using the Chart Menu.
- Show process changes
- Add target or goal lines
- Update and change control limit calculations
- Update stability analysis
- Customize charts
Control Chart Templates Automate SPC
Why Use Control Charts?
You Can't Get to Zero Defects or Zero Harm Without Control Charts!
And You Can't Sustain Improvements Without Control Charts. It's the Control Phase of DMAIC.
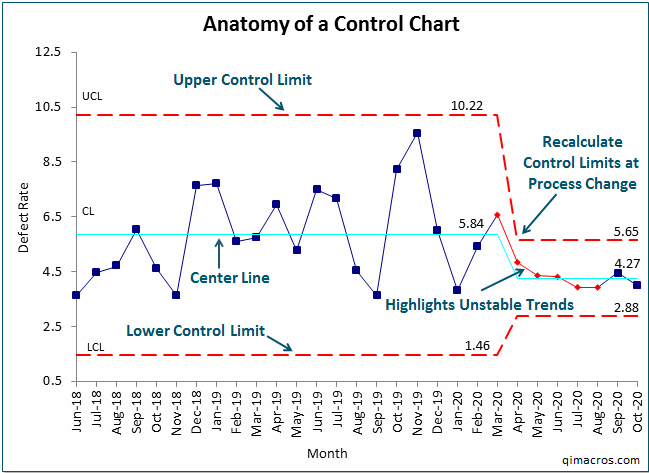
Go Deeper: What is a Control Chart?
Control Charts Evaluate Process Performance Over Time
A control chart is a graph used to track how a process performs over time. It includes an average line and upper and lower control limits that help show when something in the process may be changing or going wrong. By separating normal day-to-day variation from unusual problems, control charts help users spot issues early and keep processes stable and consistent.
Three Reasons You Need Software to Create a Control Chart
 Control Chart Types
There are seven Shewhart control charts (c, np, p, u, XmR, XbarR, XbarS) and many more for special situations.
QI Macros Control Chart Wizard selects the right chart for you.
 Control Limit Calculations
Each control chart type has different formulas for calculating control limits. They are complex.
You don't need to learn formulas. Let QI Macros do the math for you.
 Stability Analysis Rules
Control chart rules highlight points or trends that need to be investigated. These identify special causes.
QI Macros knows all of the rules so you don't need to.
Fourth Reason:
QI Macros control chart software is affordable, faster to learn, and easier to use.
Questions to consider:
- What is the difference between a control chart and a run chart?
- What are control limits?
- How do I know if my process is in control?
- When should I use a c Chart vs. a p Chart vs. a u Chart?
While both charts show patterns over time, only a Control Chart shows whether those patterns are statisically meaningful! Run Charts do not include Stability Analysis.
Control limits distinguish Control Charts from a simple line graph or run chart. They are like traffic lanes that help you determine if your process is stable and predicable or not. If a process is not predictable, it cannot be improved.
Unstable points and trends are identified in QI Macros by turning them red using Stability Analysis! You can then investigate why your point(s) and/or trend(s) are unstable.
Use a c Chart to track the total count of defects when your sample size is consistent. For example, you might be counting injuries at a plant or medication errors in a hospital.
Use a p Chart when counting defective items (pass/fail) when your sample sizes vary and each item is only counted once. For example, car doors that need to be repainted or medical bills that are wrong.
Use a u Chart when counting defective items when your sample sizes vary and each item can have more than one defect. For example, scratches on a car door or errors on a medical bill.
* View our Control Chart Design Tree here! *
Example of a QI Macros Control Chart
I purchased QI Macros just to run control charts (worth the price just for that). I had NO idea what a robust product you have developed, and what an amazing bargain I was getting. File me under exceeded customer expectations.
- Scott Campbell
Swedish American Hospital
