Need a Scatter Plot Template in Excel?
QI Macros has a Ready-Made Scatter Plot Template! Just Drop in Your Data
Example of QI Macros Scatter Plot Template in Excel
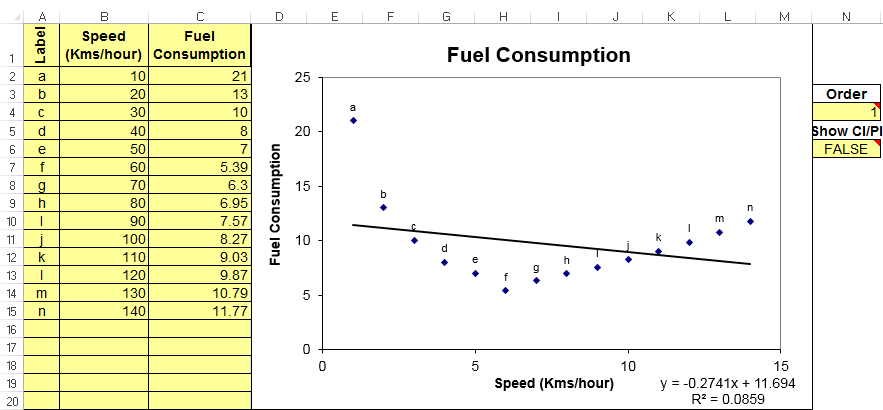
Scatter plot diagrams are used to evaluate the correlation or cause-effect relationship (if any) between two variables (e.g., speed and gas consumption in a vehicle).
When you think there's a cause-effect link between two indicators (e.g., speed and fuel consumption) then you can use the scatter plot to prove or disprove it. If the points are tightly clustered along the trend line, then there's probably a strong correlation. If it looks more like a shotgun blast, there is no correlation.
To help you even more, QI Macros calculates R2 for you and displays it in the lower right corner of the scatter plot. If R2 is greater than .80 there is a strong correlation.
You can switch the order of the X and Y axis and add/remove Confidence Intervals and Prediction Intervals!
In the Scatter template, once you have created your chart, you can switch the X and Y-Axis by inputting "1" or "2" in the "Order" section to the right of your chart. Once you have typed in 1 or 2, press Enter and your Chart will update automatically. You can also show the Confidence Interval (CI) and Prediction Interval (PI) by inputting "True" in the "Show CI/PI" section or hide by inputting "False":
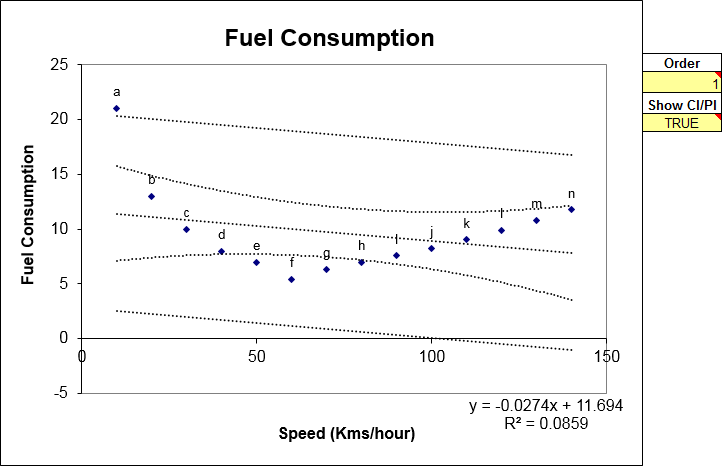
Confidence Intervals: Provide a view into the uncertainty when estimating the mean.
Prediction Intervals: Account for variation in the Y values around the mean.
Other Templates in the Scatter Plot Template Worksheet

Quadrant Scatter Chart Template
Quadrant Scatter Charts show any cause-effect relationships between two variables.
Find the Quadrant Scatter Chart Template by selecting QI Macros menu > Chart Templates > Scatter.
Input your labels in column A, and your data in columns B and C:
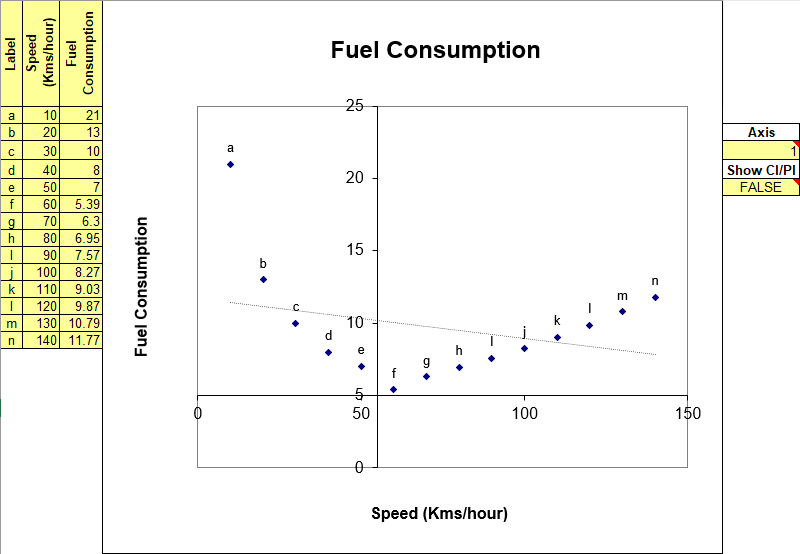
You can alternate your X-Axis order by inputting either "1" (Column 1 as X-Axis) or "2" (Column 2 as X-Axis):

Also, you can show/hide the Confidence Intervals and Prediction Intervals in cell N6: False = Hide CI/PI, True = Show CI/PI.
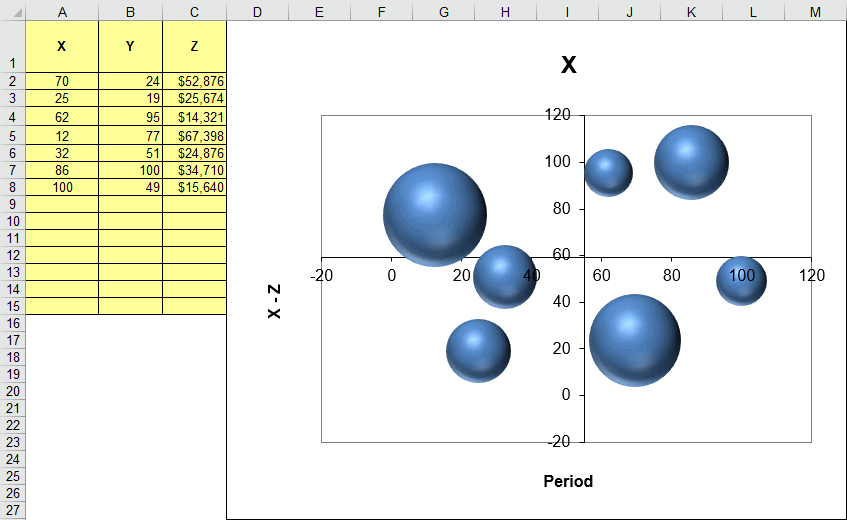
Quadrant Bubble Chart Template
Quadrant Bubble Charts show any cause-effect relationships between three variables.
Find the Quadrant Bubble Chart Template by selecting QI Macros menu > Chart Templates > Scatter.
Input your data in columns A through C and a Quadrant Bubble Chart will automatically be created!
Haven't you waited long enough?
Start creating your Scatter Plot Template in just minutes.
Download a free 30-day trial. Get the Scatter Plot Template now!
The Scatter Plot Template is one of many tools included in QI Macros add-in for Excel.
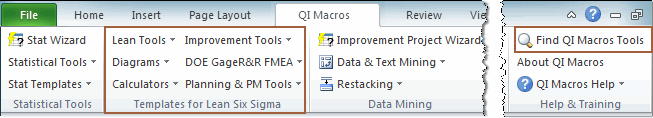
QI Macros adds a new tab to Excel's menu, making it easy to find any tool you need. If you can't locate a tool, use the find tools feature on the far right side of QI Macros menu.