Need to Create a Run Chart in Excel?
QI Macros has a Ready-Made Run Chart Template!
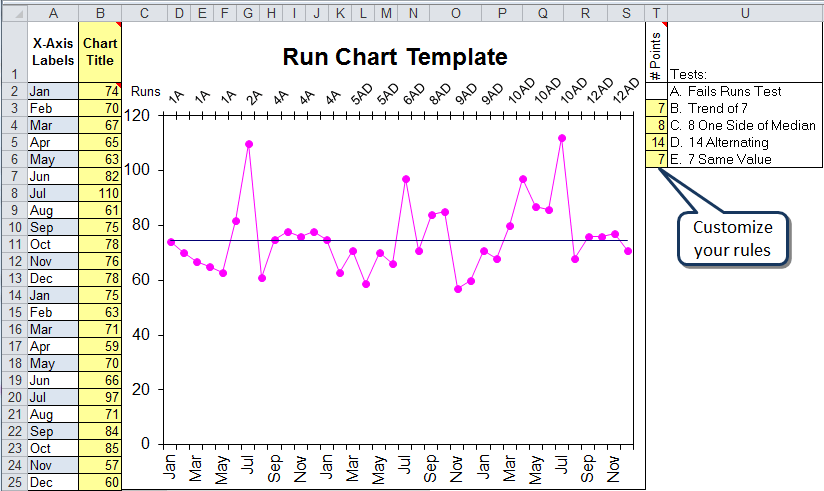
What is a run chart? Run charts consist of a graph of your data and an average or median line.
QI Macros Run Chart Template
Run Chart Rules
There are rules, similar to control chart stability rules, applied to Run Charts. These rules are built into QI Macros run chart template and can be customized by changing the values in cells T3:T6.
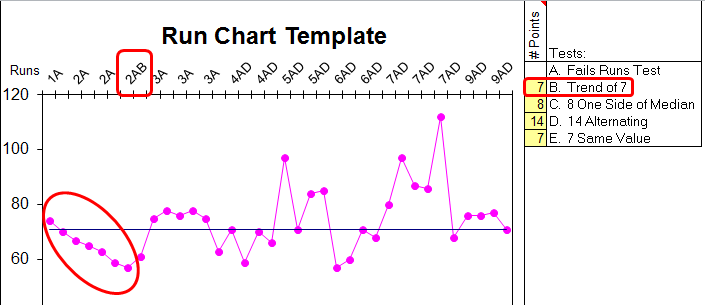
If a rule is violated, the corresponding letter, will be displayed on the top of the chart.
| Rule | Description |
|---|---|
| A | Runs Test (are there enough "runs" for the amount of data?) |
| B | Trend of seven points ascending or descending. |
| C | Eight points on one side of the median. |
| D | 14 points alternating up and down. |
| E | Seven points with the same value. |
If the data violates one or more of these rules, the appropriate letter will appear on the top axis. In this example, there are two few runs (A) and a trend of seven points decreasing (B).
Haven't you waited long enough?
Start creating your Run Chart in just minutes.
Download a free 30-day trial. Get the Run Chart now!
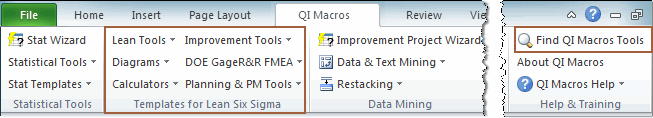
The Run Chart is one of many tools included in QI Macros add-in for Excel.
QI Macros adds a new tab to Excel's menu, making it easy to find any tool you need. If you can't locate a tool, use the find tools feature on the far right side of QI Macros menu.
Other charts included in QI Macros add-in for Excel
