Need to Create a Relationship Diagram in Excel?
QI Macros has a Ready-Made Relationship Diagram Template!
Why Use a Relationship Diagram?
To identify cause-effect or method-objective relationships among related items in a system when the interactions are complex or involved. The relationship diagram shows cause and effect relationships among many key elements. It can be used to identify the causes of problems or to work backward from a desired outcome to identify all of the causal factors that would need to exist to ensure the achievement of an outcome. In contrast, the affinity diagram, only shows logical groupings.
How to Create a Relationship Diagram
- State the problem or issue under discussion: software defects, customer retention, process steps, whatever.
- Write this on a Post-it ® note and place it at the center of a white board or on one side or the other.
- Generate cause-effect issues by brainstorming and arrange them according to cause-effect. (Note: There should be more than nine and less than fifty notes when completed, otherwise the problem is either too simple or too complex for this method.)
- Draw one-way arrows to indicate the cause-effect relationship among all of the components of the diagram. Avoid two way arrows; decide which component has the most influence and draw the arrow in one direction only.
- Identify the key issues (ones with the most arrows coming out of them) with darker lines or other shading.
Haven't you waited long enough?
Start creating your Relationship Diagram in just minutes.
Download a free 30-day trial. Get the Relationship Diagram now!
The Relationship Diagram is one of many tools included in QI Macros add-in for Excel.
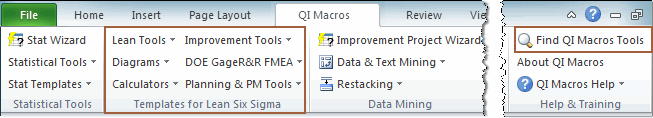
QI Macros adds a new tab to Excel's menu, making it easy to find any tool you need. If you can't locate a tool, use the find tools feature on the far right side of QI Macros menu.