Want to Draw a Bullet Chart in Excel?
QI Macros has a Ready-Made Bullet Chart Template!
Bullet Charts provide easy-to-read analysis with minimal usage of space
Developed by Stephen Few, the Bullet Chart was inspired from a traditional bar chart. It is used as an alternative to Dashboard Gauges and Radial Meters, as it removes excessive clutter in showcasing your current performance level.
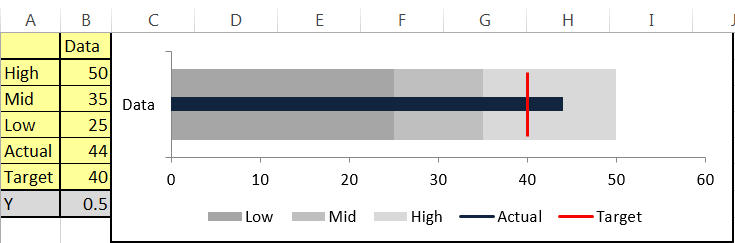
The Bullet Chart contains a single measurement which is displayed against hue variations which represent performance ranges of Low, Mid and High. In the example above, the actual level is in the high range and has surpassed the Target Value.
How to Create a Bullet Chart using QI Macros Excel Template
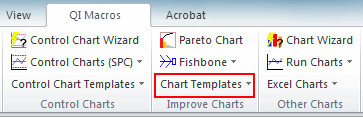
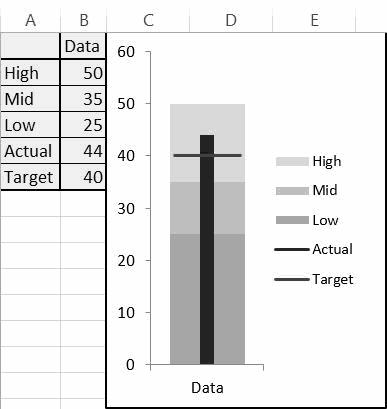
- Open the Bullet Chart template by clicking on QI Macros > Chart Templates > Bullet Chart. Once opened, you will find both a Horizontal and a Vertical layout:
- Determine your Low (poor), Mid (average) and High (excellent) performance levels, along with your Target Value.
- Input your Actual Performance Level.
See these step by step instructions for adding a fourth range to a bullet graph.
Haven't you waited long enough?
Start creating your Bullet Chart in just minutes.
Download a free 30-day trial. Get the Bullet Chart now!
The Bullet Chart is one of many charts and tools included in QI Macros add-in for Excel.
QI Macros adds a new tab to Excel's menu, making it easy to find and open any chart template you need.