Don't Understand Cpk Confidence Intervals?
Learn More About Confidence Intervals, Cpk and Sample Size
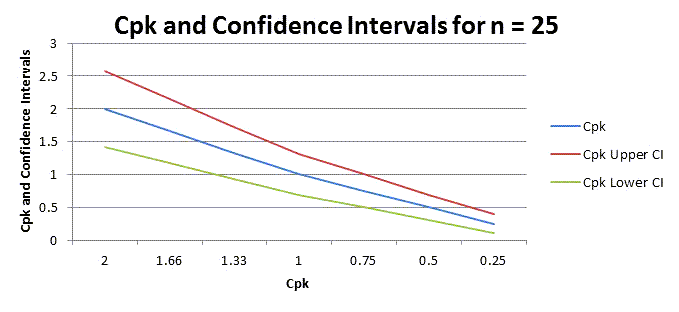
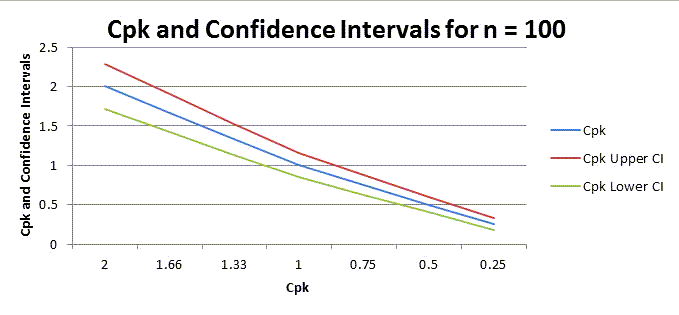
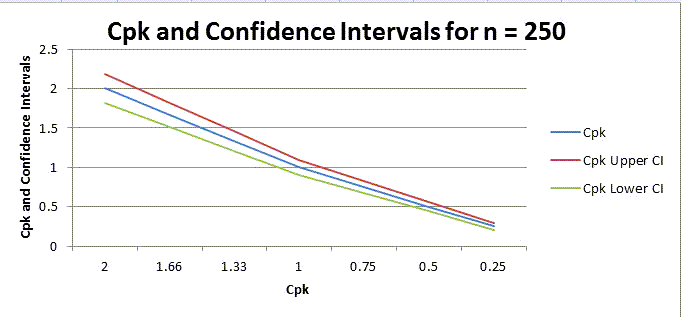
Cp and Cpk are point estimators of process capability. This means that it may be useful to understand the confidence intervals around these points. The width of confidence intervals around Cp and Cpk depend on the number of samples. As you can see from the following charts, confidence intervals can vary substantially around Cpk based on sample size.
Cpk 95% Confidence Intervals for n=25, 100 and 250
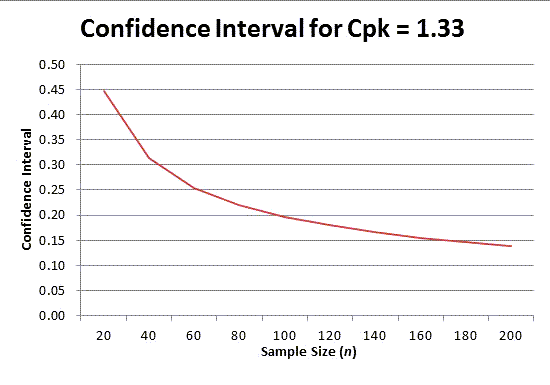
Cpk 95% Confidence Interval by Sample Size
If we use Cpk=1.33, we could calculate the confidence interval around Cpk. It begins to flatten out around n=100:
Cpk Confidence Interval Formulas for Normal Data
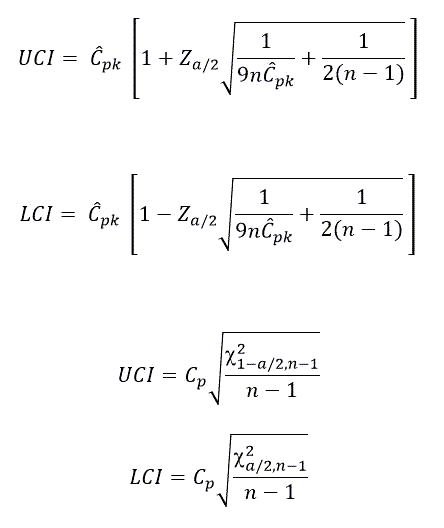
From Introduction to Statistical Quality Control (4th), Douglas Montgomery.
Cp Cpk Confidence Intervals in QI Macros
QI Macros includes the Cpk Confidence Intervals in the data calculations worksheet created by the Histogram macro. Look toward the bottom of the calculations page under the Observed / Expected PPM calculations:
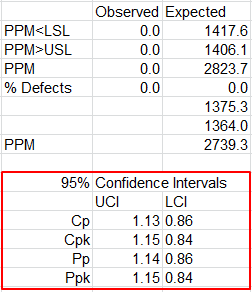
Note: This is assuming your data is normal. Also, as mentioned above, LCI and UCI change depending on your sample size. For instance, if your Cpk is 1.33 (Cpk > 1.33 is desirable), and you increase your sample size, your UCI will lower, while your LCI will rise, which creates a smaller window of Confidence – this is good, as it shows a minimizing in the degree of uncertainty associated w/ your samples.
Stop Struggling with Histograms and Cpk!
Start creating your Histograms and Cpk in just minutes.
Download a free 30-day trial. Get Histograms and Cpk now!
QI Macros Draws These Charts Too!
