Tips for Creating Charts
QI Macros Lesson 2
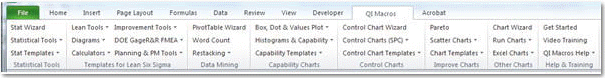
QI Macros SPC Software for Excel has Five Parts and Numerous Wizards to Assist With Your Data Analysis:
- More than 30 Six Sigma tools and SPC charts including histograms, pareto charts, scatter plots, box and whisker plots and all variable and attribute control charts. Just select your data and then click on QI Macros menu and select the chart you want to run. If you are not sure, select the Chart Wizard to run various charts on your data or the Control Chart Wizard to select the right control chart.
- More than 100 Fill-in-the-blank templates and tools including fishbones, FMEA, DOE, Gage R&R, PPAP forms and more.
- Statistical tools including Anova, f-test, t-test, regression, data normality test, sample size calculator and more. Select your data and click on the Statistics Wizard to run the most common statistical tests for your data.
- Data Mining and Analysis Tools to help organize and analyze your data including stack and restack. Includes Word Count and PivotTable Wizards to help you summarize and organize your data.
- Automated Control Chart Dashboards - just drop your data into these pre-formatted templates.
This lesson will cover charts created using macros from the pull down menu. Each of our remaining lessons will cover one of the other five parts.
To Create a Chart Using a Macro from the Pull Down Menu
Watch Tutorial Video of the Process
- Just select the data to graph (using the mouse to click and drag).
- Then, using QI Macros menu, select the chart you want to graph:
- Your original data sheet
- An intermediate sheet where all of the calculations are performed
- The sheet with the chart
QI Macros will do the math and draw the graph for you:
After the macro has run, you will usually have three worksheets:
Data Format and Selection Tips
Some of the most popular charts created with QI Macros are:
More Information on Control Charts
Control Chart Wizard - If you don't know which control chart to select, choose the Control Chart Wizard. It will analyze your data and choose the right chart for you.
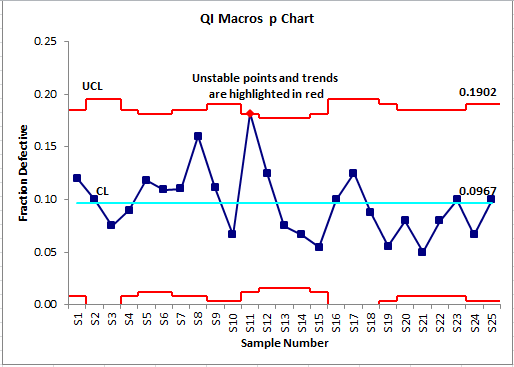
Stability Analysis - The control chart macros will run stability analysis on your data and turn any unstable points or conditions red. See these links for more information:
- Stability Analysis Rules
- How to Change Control Chart Rules
- How to Show or Hide 1 and 2 sigma lines
- How control chart limits are calculated in QI Macros
Control Chart Menu Features - After you run a control chart, QI Macros chart menu offers you several options to update or change your chart.
Need extra help understanding when to use each chart and how to analyze the results? Consider one of the following:
- QI Macros Online Video Tutorials - Step by step instructions for loading and using QI Macros.
- QI Macros Example Book - detailed explanations and examples of each chart.
- SPC Simplified Book - provides detailed explanations of control charts and histograms, the formulas and how to interpret the results.
- SPC Simplified 1-hour Training Video - Covers stability and capability analysis with a focus on the charts and what they tell you not the statistics involved.
In Lesson #3 we cover the fill in the blank templates in QI Macros.
« Previous Lesson | Next Lesson »
Purchase QI Macros SPC Software for Excel through our secure shopping cart or try a free, QI Macros 30-day trial!
Join 100,000+ Users
in 80 Countries
![]()
