Six Sigma Project Problem #3 - Lack of Connection
Have you ever heard someone tell a story, but they jump around here to there in a way that makes the story hard to follow? This is a common problem in Six Sigma projects. As I mentioned previously, I've had a chance to look at lots of Six Sigma improvement projects. Here's another way a project can go wrong—lack of connection from one step to another.
Lack of Connection
A Six Sigma project should be easy to follow from control chart to Pareto chart to Fishbone diagram to countermeasures. Often times it is not easy to follow and here's why:
- Pareto chart has nothing to do with the control chart - The first step in problem solving is to develop a control chart of current performance: defects or deviation.
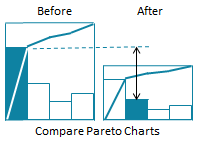
Defects - With defects, the next step is to develop Pareto charts of the most common types of those defects. All to often I find that the control chart is about one thing (e.g., defect rate) and the Pareto chart is about something else (e.g., costs). If you have a control chart of defects or defect rate, the Pareto chart should be about types of defects.
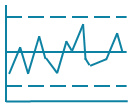
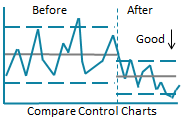
Control Chart

Pareto Chart
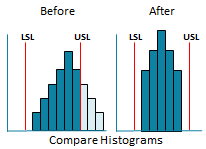
Sometimes people have a control chart about variation and then a Pareto chart about defects instead of a histogram about the variation. If you have a control chart about variation, you should have a histogram of the same variation.
Control Chart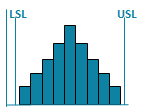
Histogram
Connect the control chart to the Pareto or Histogram. - Fishbone problem statement has nothing to do with "Big Bar" on the Pareto - Once you've analyzed the data to find the Pareto pattern, the head of the fishbone (problem statement) should contain the "big bar" on the Pareto chart. This problem statement is built into the QI Macros Fishbone diagram, but people seem to overlook it.
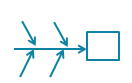
Fishbone
Pareto Chart
The head of the Fishbone should be the big bar on the Pareto. - The causes in the countermeasures aren't on the fishbone diagram - Some fishbone diagrams clearly document the root causes, but those root causes aren't carried onto the countermeasures diagram.
Fishbone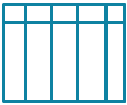
Countermeasures
Copy the root causes from the fishbone diagram to the countermeasure diagram. - Verification of the solution doesn't use the same control chart, Pareto chart or Histogram. Sometimes people forget that they have to verify the countermeasures worked. You can't just declare victory; you have to prove it.
Sometimes people use different charts to verify results. Use the control chart, Pareto chart or histogram from the analysis. Show the improvement.
How do you develop a great improvement project? The solution is simple: become a great story teller. Connect every chart or diagram to the next one in clear ways that any reader can follow.
Rights to reprint this article in company periodicals is freely given with the inclusion of the following tag line: "© 2016 Jay Arthur, the KnowWare® Man, (888) 468-1537, support@qimacros.com."
 Take our FREE Lean Six Sigma Yellow Belt training online.
Join 100,000+ Users
in 80 Countries
![]()
