Data Collection and Measurement
While most companies have too much data, people can always identify something they aren't tracking that they should be tracking. Then they think they have to set up a whole system to collect the measurement. This is a mistake. You don't know if the measurement is useful until you have collected some. Rather than wait for a measurement system, start today using the simplest of tools: a checksheet.
Check Sheet
I've use these kinds of checksheets when I'm working with a team on the Dirty Thirty process for Six Sigma. They find causes, I write them down and tally the number of times each occur. By the 30th data point, a pareto pattern appears that points us at the most common (i.e., root) cause of the problem.
Checksheet Data Collection
Nothing could be simpler than data collection with a checksheet. QI Macros have a template in the improvement tools to get you started:
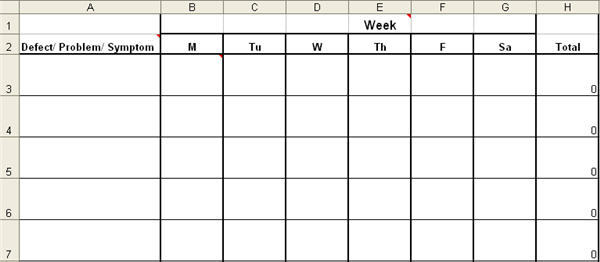
Simply print it out and start writing on it. What to write?
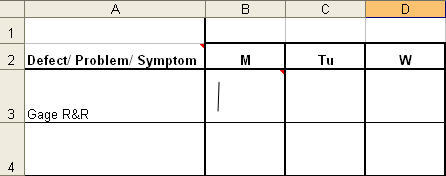
In column A, write the first instance of any defect, problem or symptom you detect. For example, if someone is calling us for support and they have a problem with understanding GageR&R, then we'd write "GageR&R" in A3 and put a stroke tally in the day of the week (e.g., Monday):
Then continue as the week goes on, adding defects, problems or symptoms. By the end of the week, we'll have an interesting picture of support calls.
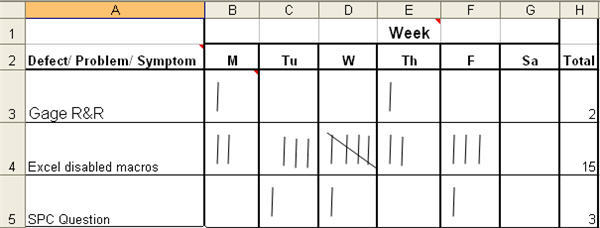
Just add up the number of calls and "Excel disabled macros " jumps out as the majority of the calls. Create a pareto chart to better demonstrate this.
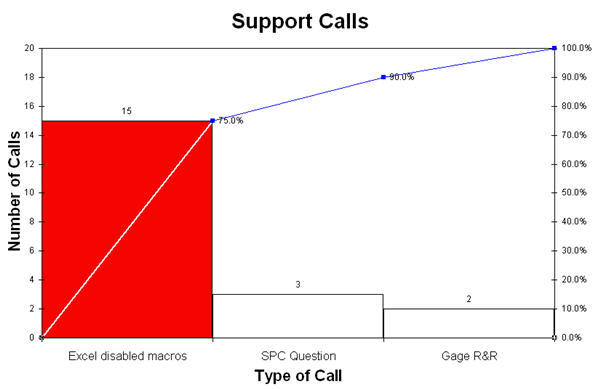
But now the questions arise:
- Does a specific version of Excel disable the macros?
- What are the SPC Questions about? Histograms? Control Charts? Which control chart?
- And so on.
Well, if we spent a lot of time and money setting up a measurement system to track just these items, it wouldn't do us much good. Now we can tune up the checksheet to give us better data:
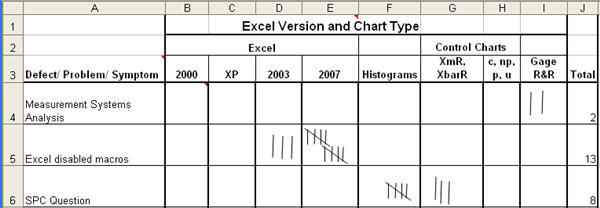
Aha! Excel 2007 seems to disable the macros more than other versions. Did Microsoft change something? Is it something we can mistake-proof? And we get more histogram questions than control chart questions. Can we improve our online documentation about the histograms?
Get the idea? Use a checksheet to prototype your data collection efforts. Iterate until you start to understand what you really need to know to make improvements. A series of checksheets may be all you need to solve a pressing problem. If necessary, you can implement a measurement system to collect the data over time.
So please, don't wait for a magical, all encompassing measurement system to deliver data. It's not going to happen. And I often find it's just an excuse to avoid making improvements ("I can't because I don't have the measurements I need.")
Haven't you waited long enough to start making measurable improvements (even if your data collection tool is just a checksheet)? Or are you going to keep letting loads of cash slip through your fingers. All it takes is a checksheet and a pencil. Get on with it.
Rights to reprint this article in company periodicals is freely given with the inclusion of the following tag line: "© 2008 Jay Arthur, the KnowWare® Man, (888) 468-1537, support@qimacros.com."

 Take our FREE Lean Six Sigma Yellow Belt training online.
