Is Your Gage R&R Template Accurate?
QI Macros Gage R&R template is!
QI Macros has been validated using data provided by Ford and AIAG.
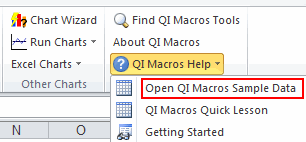
The data for validating Gage R&R, Cp, Cpk etc. has been included in the AIAG SPC sample data set that is installed with QI Macros. To access the sample data, click on QI Macros Help on the far right side of QI Macros menu. Next click Open QI Macros Sample Data to access the folder where all of the files are located.
To Test QI Macros Gage R&R Template Yourself
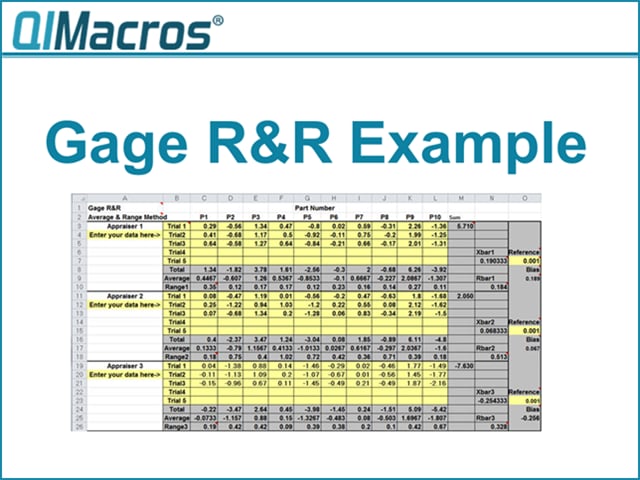
- Use QI Macros to re-stack the data to match the Gage R&R input format.
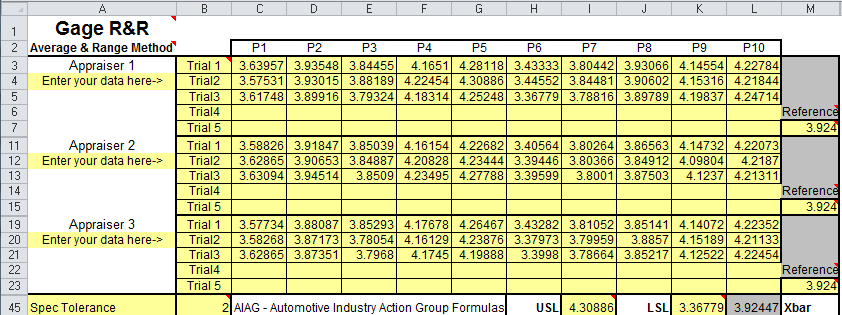
- Input the data into the QI Macros Gage R&R template (C3:L5, C11:L13, C19:L21).
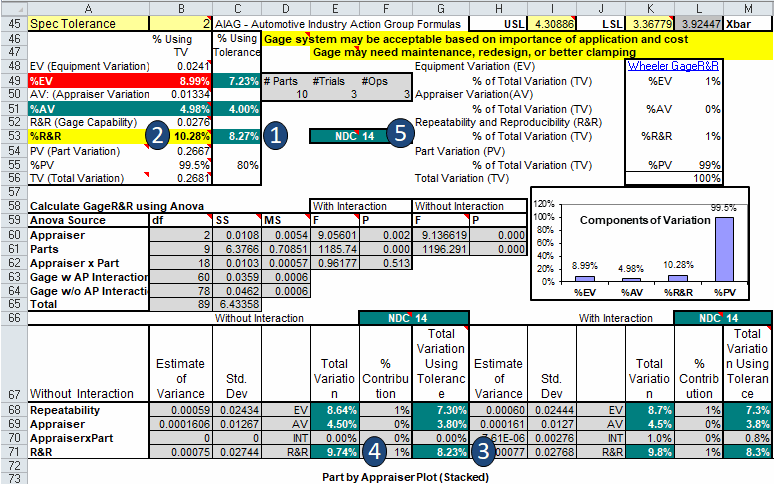
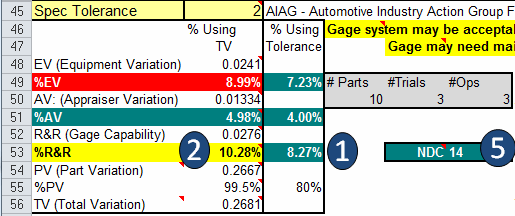
- Enter the Specification tolerance (2) into cell B45, to get the following:
Compare to Ford Expected Results:
# |
Gage R&R Calculation | Expected Result |
|---|---|---|
1 |
Gage R&R as a percent of tolerance using the Average and Range Method | 8.27 |
2 |
Gage R&R as a percent of study variation using the Average and Range Method | 10.28 |
3 |
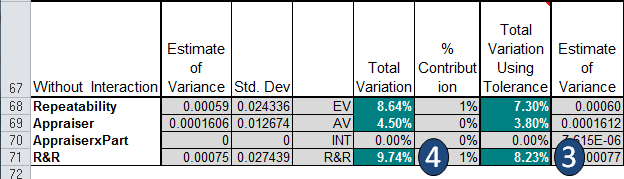
Gage R&R as a percent of tolerance using the ANOVA Method | 8.23 |
4 |
Gage R&R as a percent of study variation using the ANOVA Method | 9.74 |
5 |
Number of Distinct Categories (NDC) | 15 |
QI Macros Match! Anova Method
Using percent of tolerance (cell G70 = 8.23)
Using percent of variation (cell E70 = 9.74):
QI Macros Match! Average and Range
Using specification tolerance %R&R (cell C52 = 8.27)
Using part variation (cell B52 = 10.28) and
NDC (cell F52 = 14).
Ford Data Gage R&R Study with QI Macros
You don't have to be an expert.
Use QI Macros Gage R&R template to mistake-proof your calculations.
Download a free 30-day trial. Get the Gage R&R template now!
QI Macros Draws These Charts Too!
