Can Excel Read Your Report?
Reformatting Downloaded Reports for Data Analysis
Often, one of the biggest challenges is to get reports into a format that's easy to use with PivotTables. Here's a simple problem. The dates are in the same column as the part number.
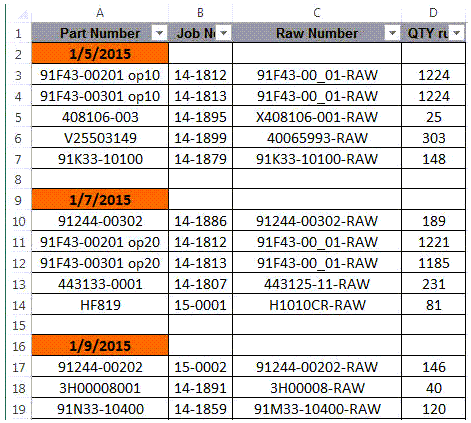
It's not possible to use a Pivottable to summarize this data by date until we move the dates into a separate column.
Use Excel Formulas to Create a Date Column
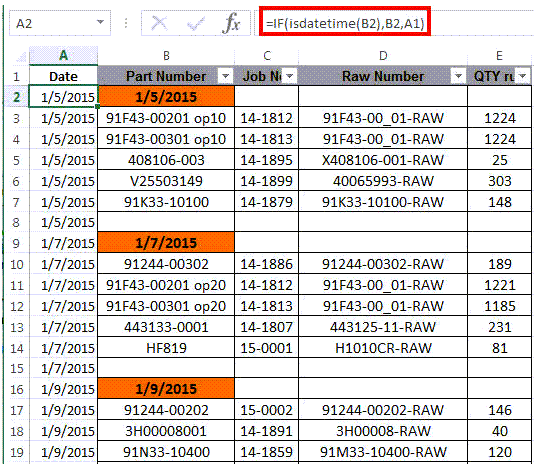
- Insert a column to the left of column A.
- Name the new A column "Date"
- Populate the cells in column A with a date using the Logical formula "IF." Start the formula in cell A2 and copy down to the next rows. The formulas is: =IF(isdatetime(B2),B2,A1) and reads as follows:
- First, check for a date in column B: =IF(isdatetime(B2)
- If B2 contains a date then use it: ,B2
- If B2 does not contain a date, then use the previous cell: ,A1
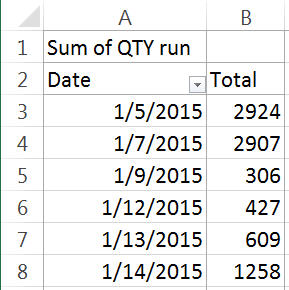
Use Excel's PivotTables to Summarize Production by Date:
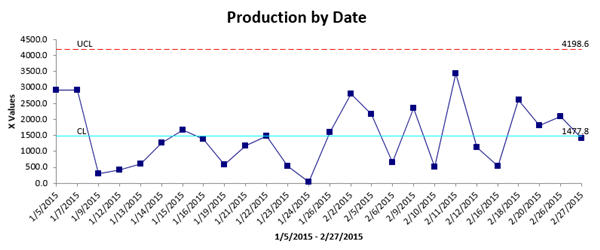
Use QI Macros to Turn it into a Control Chart of Production:
Get the Idea?
There's a wealth of information in downloaded reports, but it's often difficult to analyze because it's formatted for people to read, not Excel. Start using Excel formulas and PivotTables to summarize data by date. Then use QI Macros to graph the results. You'll find it increasingly easy to analyze your data and start making breakthrough improvements.
Other Charts Included in QI Macros for Excel
Join 100,000+ Users
in 80 Countries
![]()
