Time Tracking to Reduce Cycle Time
One of the principles of Lean Thinking is to eliminate delays which consume up to 95% of the total cycle time. But to understand cycle time and delays, you will need a simple way to track the time it takes a product or service to travel through your process. Excel helps make this easy.
Time Tracking
Entering dates or time into a cell in an Excel worksheet is error prone - many "/" and ":" and numbers: 05/14/05 07:05. Here's the good news: Excel will populate a cell with the current date and time with a single keystroke.
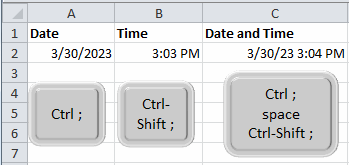
The keystrokes are:
- Date - Ctrl(;) (i.e., hold down the control key and press the semicolon)
- Time - Ctrl-Shift(;) (i.e., hold down the control and shift keys and press semicolon)
- Both Date and Time: Ctrl(;) + Space + Ctrl-Shift(;) Don't hold the Ctrl key down when hitting Space.
Pretty simple isn't it? This starts to make it easy to measure cycle time or length of stay. Here are some examples:
- A muffler shop measuring the time from when a car arrives until the owner picks it up.
- A hospital emergency room measuring the time from when a patient arrives until they are discharged or admitted to the hospital.
- A transcription service measuring the time from when a transcription is started until it's finished.
Get the idea?
Calculating Cycle Time
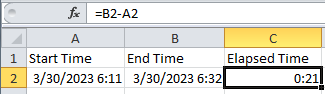
To get the actual cycle time from start to finish, simply subtract the start time from the end time using the formula (=endcell-startcell)
Then, right click on the cell to format the calculated cycle time hours and minutes:
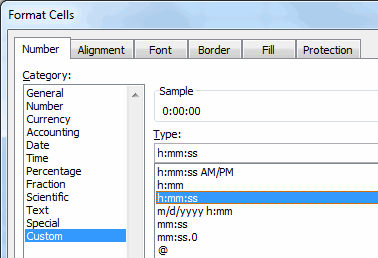
This time format will allow you to have more than 24 hours. Other time formats are limited to 24.
Converting to Hours or Minutes
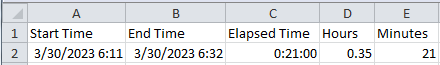
Since Excel stores dates and times as numbers (e.g. 3/30/2023 6:11:00 AM is 45015.2276) you have to convert the time to hours or minutes to have any hope of graphing the data in a useful way.
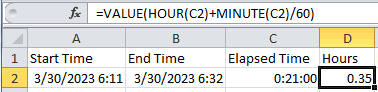
Excel will automatically change this calculated value to time format, which isn't that useful, so you will have to change the cell format back to "General" or simply enclose this formula within the "Value" function.
In this example, I'm calculating minutes instead of hours:
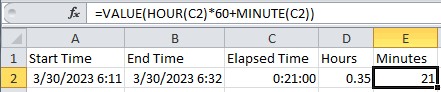
The result is a decimal number of hours or minutes:
Either of these, hours or minutes, can be used to feed the QI Macros XmR control chart template to create reports automatically as you enter the data.
Case Study - Patient Length of Stay
Many hospital emergency rooms are aiming to get a patient from the door to doctor in under 30 minutes. Last year's Baldridge award winning hospital even offers a guarantee that the patient will see a nurse in under 15 minutes and a doctor in less than 30 minutes. To do this, emergency departments have to be able to track the time for each activity:
- Sign In
- Triage (nurse)
- Exam (doctor)
- Discharge (or bed requested)
- If admit to hospital (Bed Request Time)
- Bed Assigned Time
- Patient to Assigned Bed
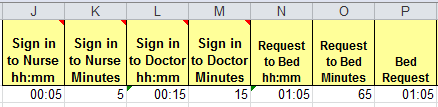
I recently created a system for a hospital's emergency department to track patient length of stay using our time tracking tool found under Templates for Lean six Sigma > Lean > Time Tracking.
I opened the 10 step template and updated the descriptions in row 1 to match the department's process. The clerk in the emergency room simply enters the date and times for each patient using the time tracking template.
![]()
Then I use formulas to calculate the times:
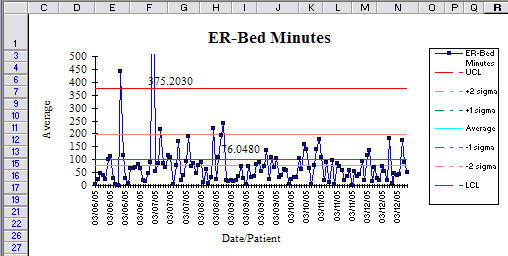
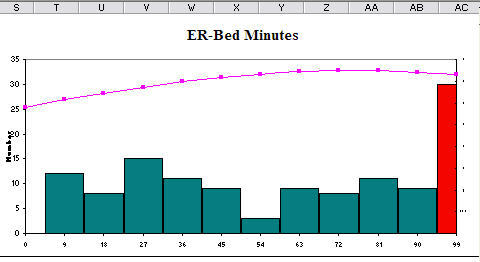
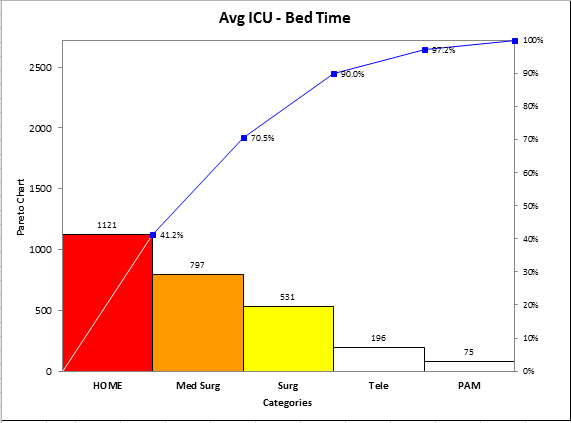
Then I can copy and paste a link from the times into the QI Macros XmR template, or use Excel's pivot table function to calculate an average time per day and paste that into the XmR template. Since patient satisfaction starts to decline sharply after two hours in the emergency room, I set the upper specification limit for the histogram to 90 minutes. I can even link the data to a pareto chart by doctor or floor.
Here's my point:
Without measurement, you can't improve. Tracking defects is often easy, but measuring cycle time and delays often seems intimidating. With Excel and a few key strokes you can start tracking key time points in your process. With QI Macros, you can turn those times into control charts and histograms to help manage the business.
Turn on your time tracking! Then start to eliminate the delays that are costing you time, money and customers.
Need a Custom Tracking Tool for Your Business?
Let us build it for you. Just list your key measurement points (e.g., hand-offs) and give us a call or email your request to knowwareman@qimacros.com. We will send you an estimate.
Stop using old technology!
Upgrade Your Excel and Data Analysis Skills to Smart Charts Using QI Macros.
Track Data Over Time
Line Graph
Control Chart
Compare Categories
Pie Chart
Pareto Chart
Analyze Variation
Bar or Column Chart
Histogram
QI Macros add-in for Excel makes creating smart charts a snap.
Join 100,000+ Users
in 80 Countries
![]()
