Control Charts and Normality
Do You Need to Normalize Data Before Running SPC Charts?...No!
I got a call from a Six Sigma trainer the other day. He asked: Do QI Macros automatically normalize data before creating a control chart? Seems he had a couple of PhDs in his class that seemed to think that you had to normalize data before you do anything. From my point of view, this is silly. You could do a Box Cox transformation of your data, but why bother. Control charts are very robust to non-normal data. Don't believe me? Read Donald Wheeler's discussion of this matter here.
I find that far too many belts try to over complicate the problem solving process. They try to use complicated methods and tools to solve uncomplicated problems. And often, they fail, because they took an overly complicated approach to the process.
What Are We Trying To Do With A Control Chart?
There are two things we want to accomplish with a control chart:
Whichever Direction is "Good"
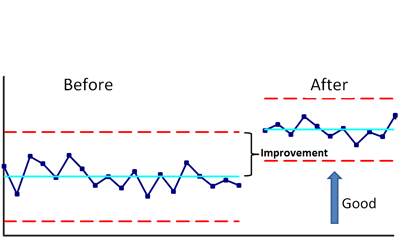
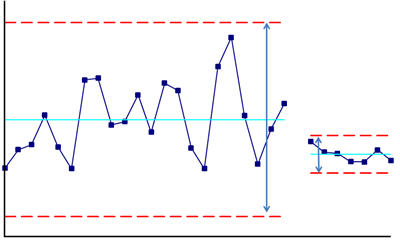
That's it. You don't need to transform the data to do this and it might actually obscure your results.
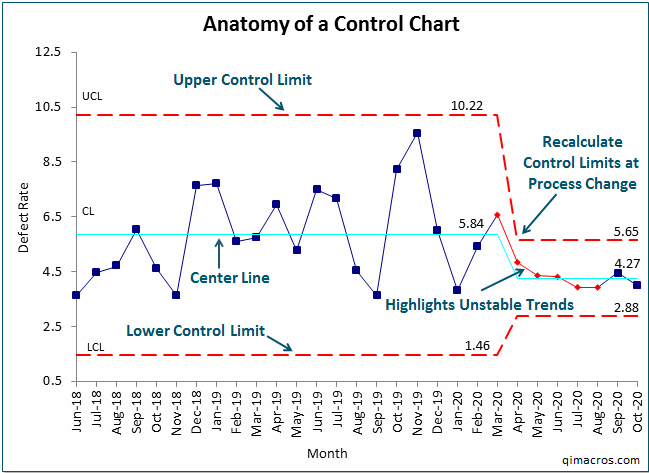
Use QI Macros Chart Menu to Show Process Changes:
What Are We Trying To Do With a Histogram?
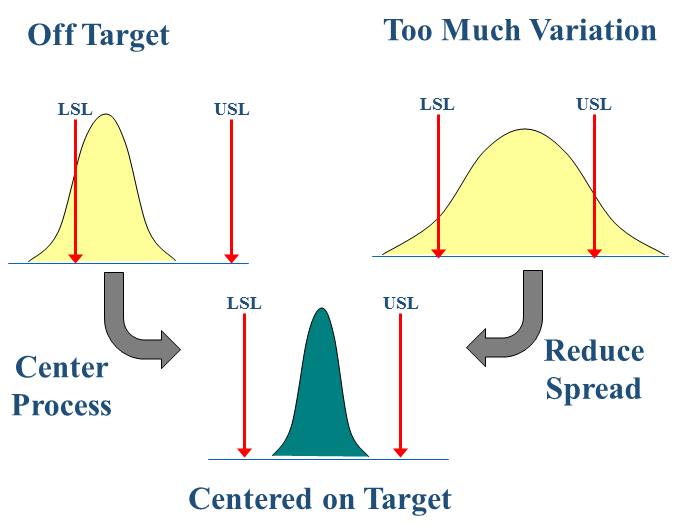
The same is true of a histogram. What are we trying to do?
Fit Within the USL/LSL
This is true, even if you have non-normal data such as turnaround or cycle times.
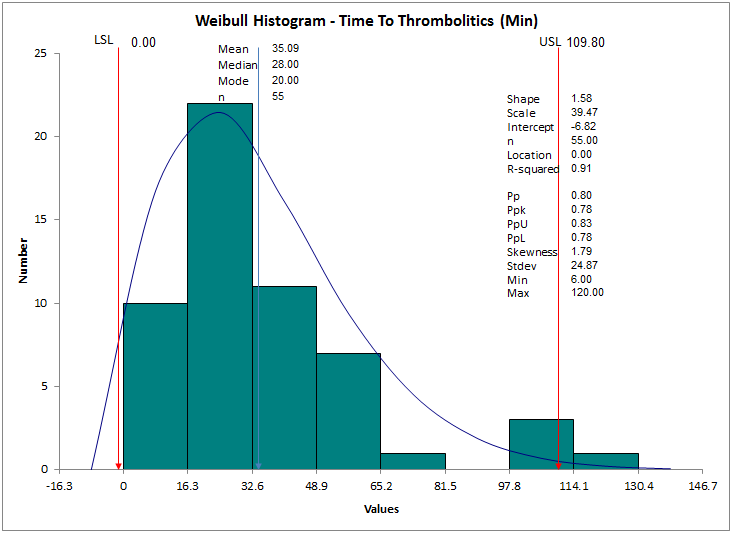
Here's a Weibull histogram of time to thrombolitics—drugs that dissolve clots in a heart patient. Clearly non-normal, but which way do we want to move the data? Toward the left! Do you need to normalize this data to use it? No. Can you use a Weibull histogram to display non-normal data? Yes.
Here's My Point
Stop obsessing over normality. You don't need to normalize data to draw a control chart or a histogram. You just need to know what you're trying to accomplish through improvement: move the center and reduce the variation.
Are there situations where you will need to normalize data? Sure, but in 25 years of process improvement I haven't needed to do it yet. Stop trying to over complicate the improvement process. It's a terrible and unnecessary form of waste.
Stop Struggling with Control Charts!
Start creating your Control Charts in just minutes.
Download a free 30-day trial. Get Control Charts now!
Other Charts Included in QI Macros for Excel
Join 100,000+ Users
in 80 Countries
![]()

KnowWare International, Inc.
2696 S. Colorado Blvd., Ste. 555
Denver, CO 80222 USA
Toll-Free: 1-888-468-1537
Local: (303) 756-9144