Looking for an XbarS Chart Six Pack in Excel?
QI Macros has one that's the same as Minitab's Capability Sixpack™, for a fraction of the cost.
You don't have to spend alot of money on expensive software to perform process stability and capability analysis on your data.
QI Macros XandS template makes SPC as easy as typing data into an Excel spreadsheet.
Open up the XbarS Six Pack by clicking on the QI Macros tab on Excel's menu, then Control Chart Templates then XbarS Six Pack.
Then just type your data into the yellow input area and the control charts, histogram, values plot and probability plot will be drawn to the right. You can also cut and paste data from another spreadsheet into the template:
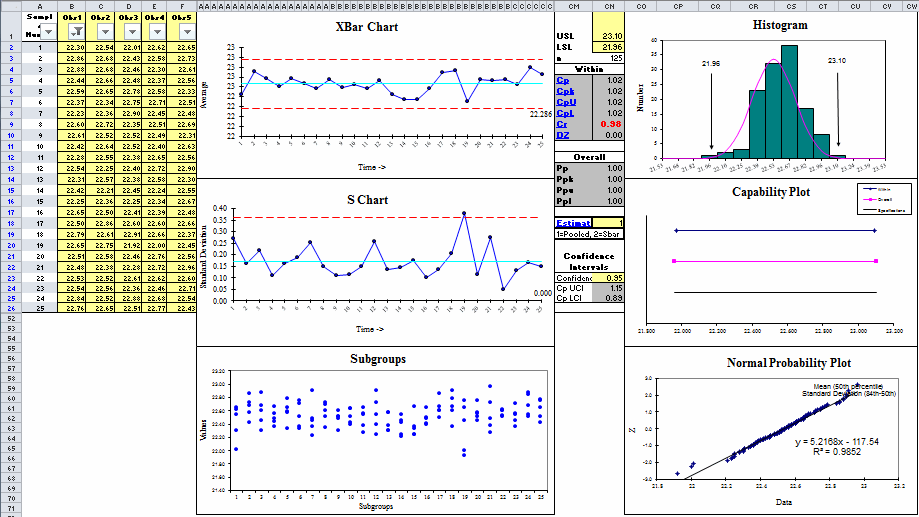
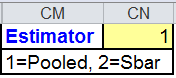
Sigma Estimator Formula
The X and S Six Pack also lets you choose which formula you want to use for sigma estimator. The default is Pooled Standard Deviation but you can also select Sbar by changing the number in cell AV:2:
XbarS 500 Skyline and XmedianS 500 Templates
If your data set is made up of more than (30) columns of data, you can use the XbarS 500 Skyline or XmedianS 500 templates - these have been developed for end users to input up to (500) columns of data:
![]()
NOTE: These (500) column templates are included in the January 2021 version of QI Macros.
Stop Struggling with XbarS Charts!
Start creating your XbarS Charts in just minutes.
Download a free 30-day trial. Get XbarS Charts now!
QI Macros Draws These Charts Too!

KnowWare International, Inc.
2696 S. Colorado Blvd., Ste. 555
Denver, CO 80222 USA
Toll-Free: 1-888-468-1537
Local: (303) 756-9144