Want to Define the Data used to Calculate Control Chart Limits?
It's Easy to Set or Fix Control Chart Limits Using QI Macros
Why It Matters: Control Limits are calculated from your data. They are used to identify unstable points and trends that need to be investigated.
How QI Macros Control Limit Calculations Work
Control Chart templates will automatically recalculate the control limits and add data to the chart as it is input.
Control Chart macros use the data you initially select to calculate the control limits. If you select 20 points, 20 points are used. If you select 14 points, then 14 points are used and so on. When you add data to an existing chart, the limits stay the same.
If you want to change the data points used to calculate the control limits after you have added new data:
- use Recalculate UCL /LCL to use ALL of the data points.
- use Fix Control Limits to use a subset of the data points.
Here's how to use the Fix (Set) Control Limits option:
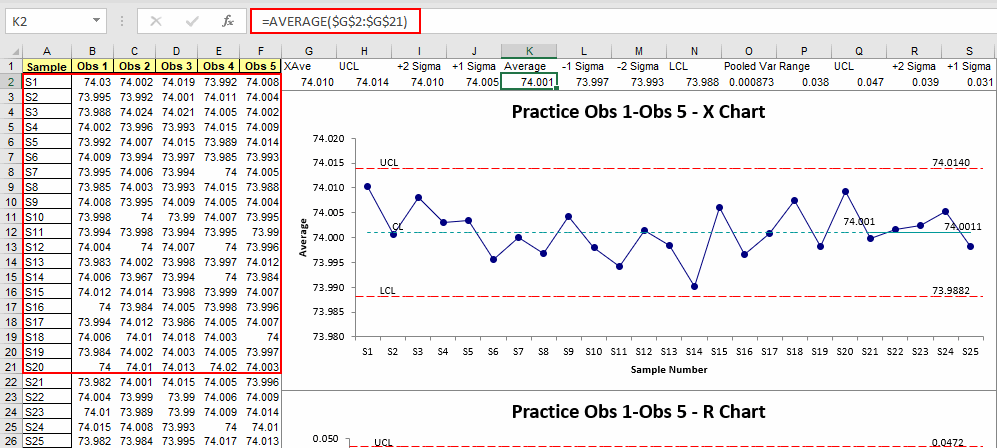
- Click on the last point you want to include in the control limit calculations:
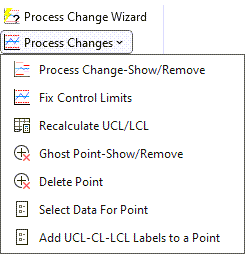
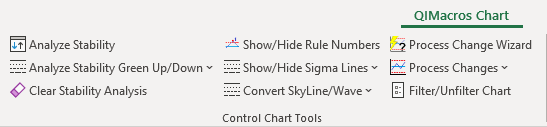
- Click on the QI Macros Chart menu > Process Changes, and then select "Fix Control Limits":
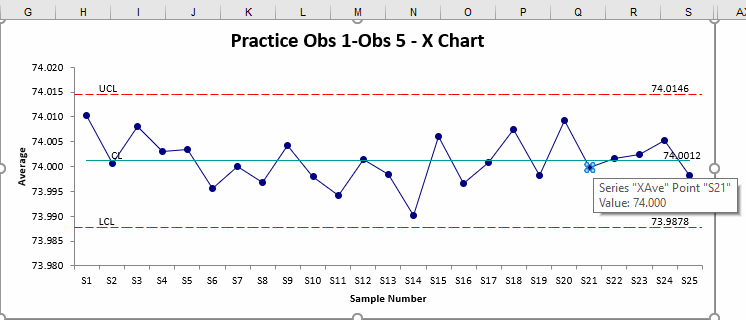
- QI Macros will use the selected point and all previous points to calculate the control limits:
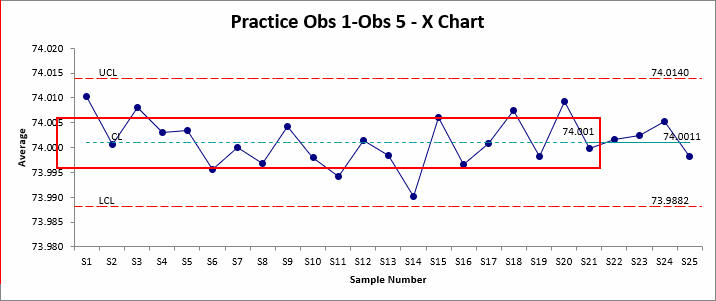
- Your chart will indicate which data points are used to calculate the control limits by the format of the centerline. The
centerline up to and including the point you selected, will be dashed. A dashed centerline identifies the data points used to calculate the control limits. Additional points on the chart, that are not used in control limit calculations, are designated by a solid centerline.
- Don't forget to click on Analyze Stability to rerun stability analysis using the new control limits:
Learn More...
- Fixed Limit Control Chart Using Predefined Limits
- Fixed Limit Control Chart Template
- Control Limits Article
Stop Struggling with Control Charts!
Start creating your Control Charts in just minutes.
Download a free 30-day trial. Get Control Charts now!
QI Macros Draws These Charts Too!
