Need to Add Target or Goal Lines to Control Charts?
QI Macros Makes it Easy
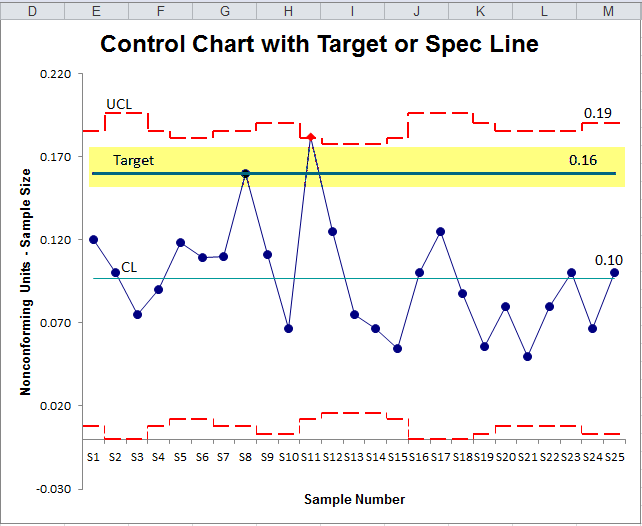
Use Goal or Spec Limit Lines to Compare to Targets
Control chart limits are calculated from your data. However, many customers also want to show a target or spec limit line for comparison.
QI Macros Control Charts Provide Several Ways to Add a Target Line
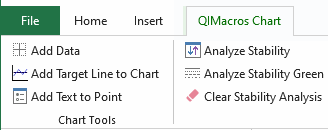
Option 1: Easy to Use Add Target Line Feature on QI Macros Chart Menu
- Click on a chart, then click on QI Macros Chart Menu. The Add Target Line to Chart tool is on the far left:
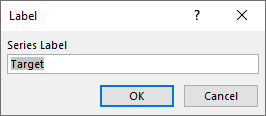
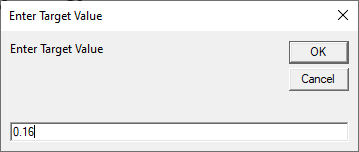
- Click on Add Target to Chart and it will prompt you to name the line and designate its value:
- You can add as many lines to your chart as you need.
Option 2 - Use Excel's drawing tools to simply draw a target line on your existing control chart.
- To view Excel's drawing tool bar select View/Tool bars and check the box next to "Drawing."
- Next simply draw a line on your chart.
- You can use the text box feature on the drawing tool bar to add a label to the line.
- Note: If you add data to the chart you may need to re-sync up the line.
NOTE: It is not possible to perform an Add Target Line to a Run Chart Dashboard.
Learn More...
Stop Struggling with Control Charts!
Start creating your Control Charts in just minutes.
Download a free 30-day trial. Get Control Charts now!
QI Macros Draws These Charts Too!
