Need to Draw a 30,000 Foot Control Chart in Excel?
QI Macros add-in can create a 30,000 ft chart in seconds.
The 30,000 foot control chart was developed by Forrest W. Breyfogle III as part of his 30,000 foot level metric tracking approach. Both are part of the Integrated Enterprise Excellence (IEE) Business Management System he developed.
Further information about the 30,000 foot level metric tracking approach can be found on his website at www.smartersolutions.com. Here is an excerpt:
"With this approach, the organization will be tracked using high level metrics so that typical response levels from inputs within the system (even though they are assignable) will be reported as common-cause variability.
For this to occur, an infrequent subgrouping/sampling plan is needed so that potential input variables, which can affect the response, occur between these subgrouping categories. A control chart will then be created so the between-subgroup variability magnitude affects the lower control limit (LCL) and upper control limit (UCL) calculations.
With this approach, high level business metrics such as revenue and profit would typically be tracked using a monthly infrequent subgrouping/sampling plan."
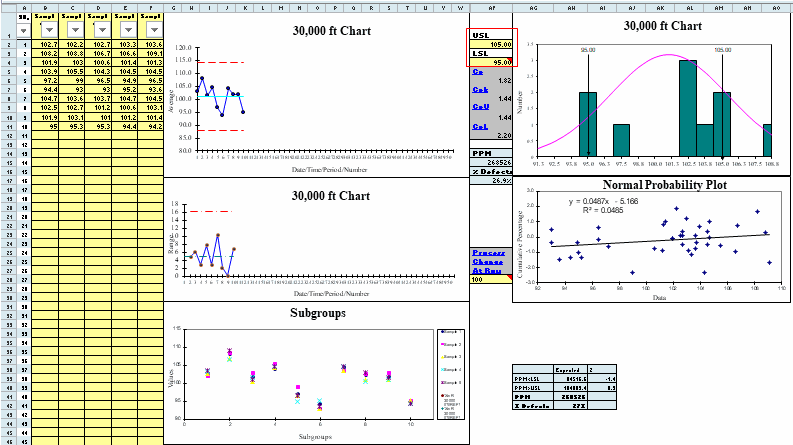
QI Macros add-in for Excel contains a 30,000 foot control chart template
Just type data into the yellow input area and the chart will automatically be drawn to the right of your data set.
Enter USL/LSL in cells AF2 and AF4 to get parts per million (PPM) and percent defects in cells AF15 and AF17. You can also cut and paste data from another spreadsheet into the template:
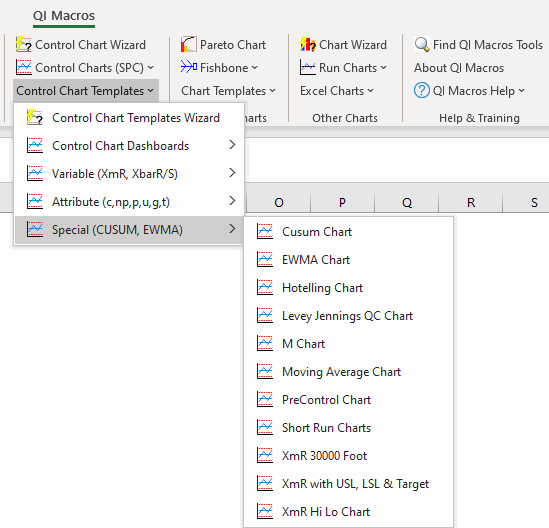
You can find this template by selecting the "QI Macros" menu > Control Chart Templates > Special (CUSUM, EWMA) > XmR 30000 Foot:
Stop Struggling with Control Charts!
Start creating your Control Charts in just minutes.
Download a free 30-day trial. Get Control Charts now!
QI Macros Draws These Charts Too!
